|
USD/JPY Asia Price Forecast: Greenback grinds up above the 110.00 figure vs. yen
- USD/JPY is challenging the 110.10 resistance level.
- The rising wedge pattern can limit the bullish run.

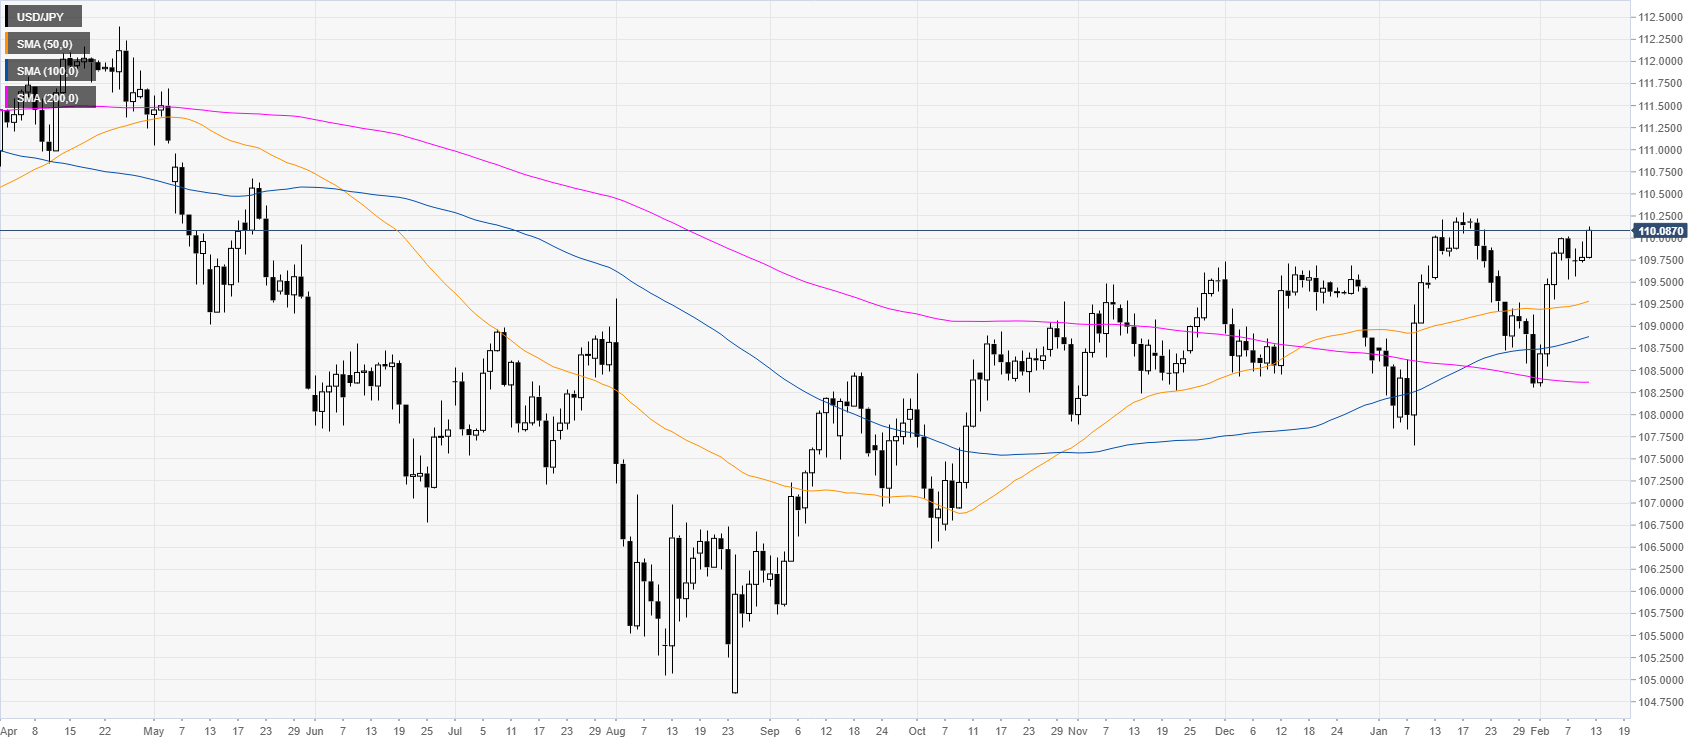
USD/JPY daily chart
USD/JPY broke above the 110.00 figure while trading above its main daily simple moving averages (SMAs). Bulls are eyeing at the 2020 highs.
USD/JPY four-hour chart
USD/JPY is trading in a rising wedge while above the main SMAs. The spot is challenging the 110.10 resistance and bulls want to break above it to reach January highs near the 110.34 level. A break above the January highs can lead to an acceleration towards the 110.60 level. Support is seen at the 109.92, 109.65 and 109.30 levels, according to the Technical Confluences Indicator.
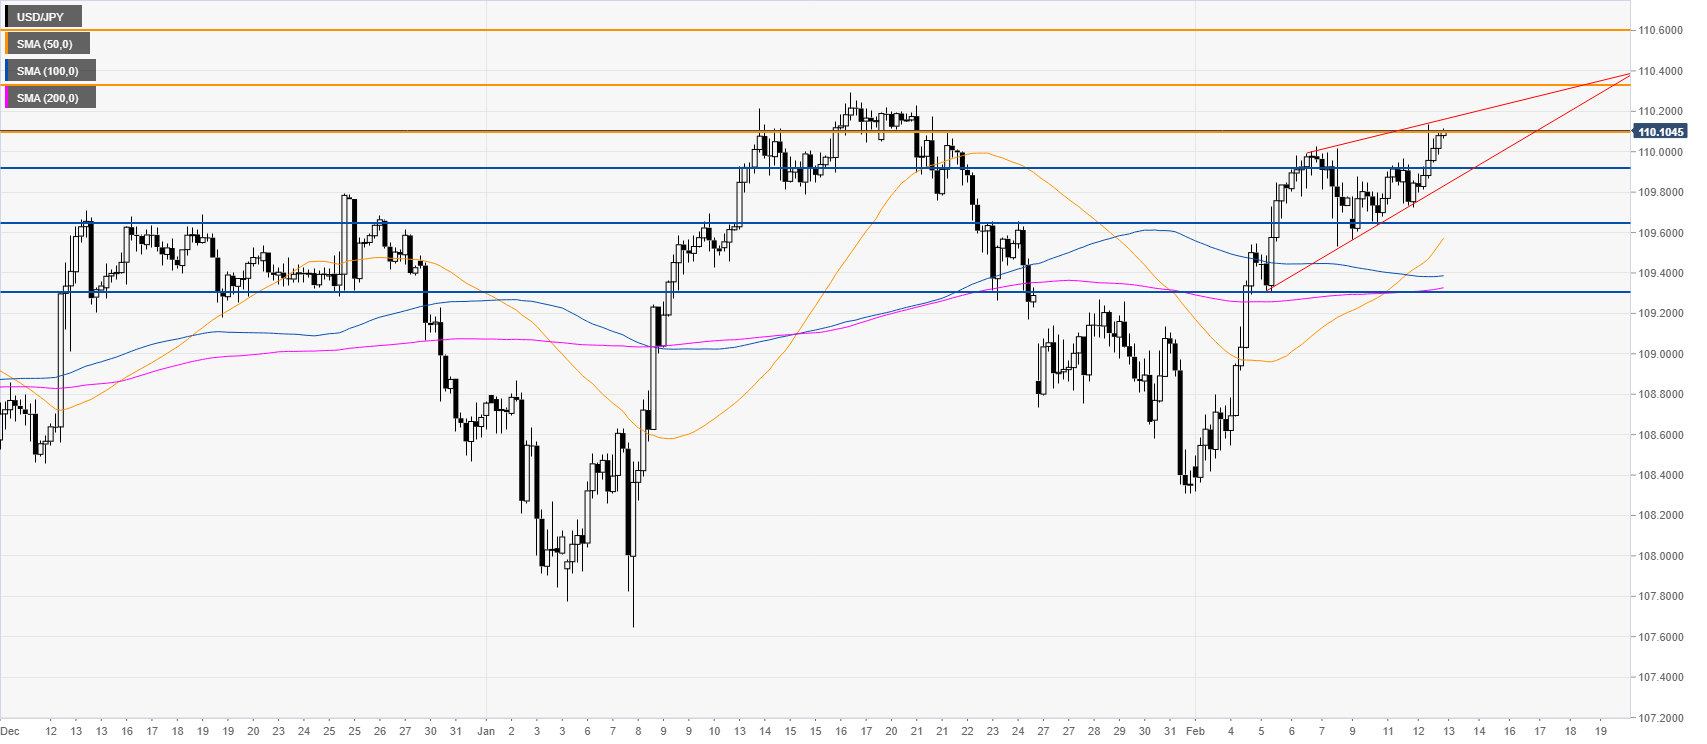
Resistance: 110.10, 110.34, 110.60
Support: 109.92, 109.65, 109.30
Additional key levels
Author

Flavio Tosti
Independent Analyst
More from Flavio Tosti


