|

USD/INR technical analysis: Struggles between 50, 100-day SMA

  • USD/INR witnesses pullback from 38.2% Fibonacci retracement.
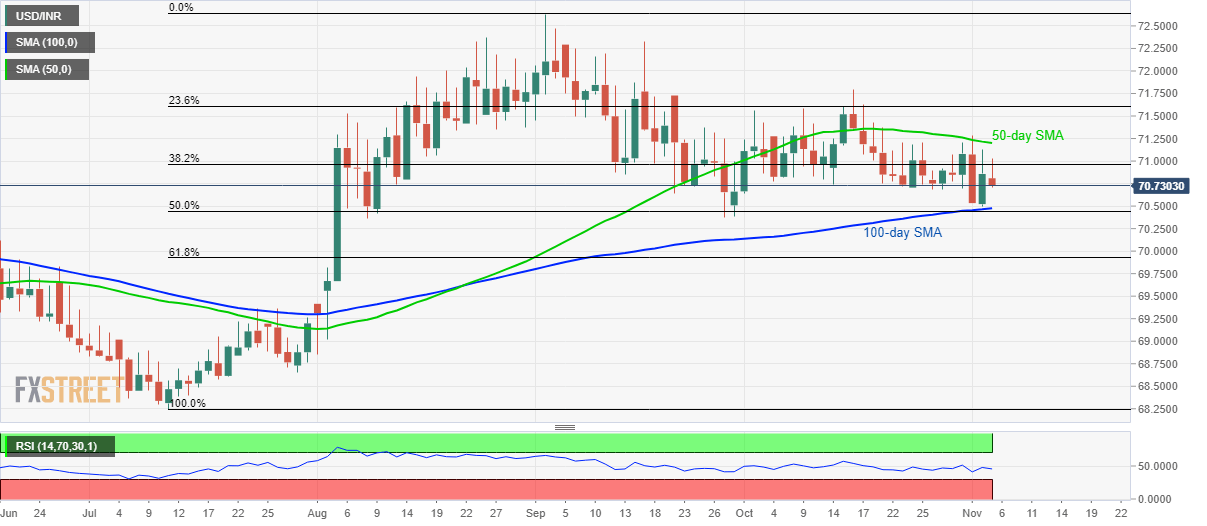
  • 50% Fibonacci retracement, 70.36/35 add to support.

Following its trading range between the key moving averages, USD/INR declines to 70.72 while heading into the European session on Tuesday.

The quote recently took a U-turn from 38.2% Fibonacci retracement of July-September upside, at 70.96, indicating another visit to 100-day Simple Moving Average (SMA) level of 70.47. Also increasing the strength of the support is 50% Fibonacci retracement.

It should, however, be noted that pair’s declines below 70.47 will aim for 70.36/35 support-zone including lows marked since early August.

During pair’s extended weakness below 70.35, 61.8% Fibonacci retracement level of 69.92 and late-July highs close to 69.36 will become sellers’ favourites.

Meanwhile, pair’s sustained rise past-50-day SMA level of 71.20, can target October high surrounding 71.80 whereas 72.30 and 72.65 could please bulls afterward.

USD/INR daily chart

Trend: sideways

additional important levels

Overview
Today last price70.721
Today Daily Change-0.1355
Today Daily Change %-0.19%
Today daily open70.8565
 
Trends
Daily SMA2071.0006
Daily SMA5071.2158
Daily SMA10070.4638
Daily SMA20070.1961
 
Levels
Previous Daily High71.125
Previous Daily Low70.4975
Previous Weekly High71.2825
Previous Weekly Low70.5329
Previous Monthly High71.79
Previous Monthly Low70.6425
Daily Fibonacci 38.2%70.8853
Daily Fibonacci 61.8%70.7372
Daily Pivot Point S170.5277
Daily Pivot Point S270.1988
Daily Pivot Point S369.9002
Daily Pivot Point R171.1552
Daily Pivot Point R271.4538
Daily Pivot Point R371.7827

Author

Anil Panchal

Anil Panchal

FXStreet

Anil Panchal has nearly 15 years of experience in tracking financial markets. With a keen interest in macroeconomics, Anil aptly tracks global news/updates and stays well-informed about the global financial moves and their implications.

More from Anil Panchal
Share:

Editor's Picks

EUR/USD looks offered below 1.1900

EUR/USD keeps its bearish tone unchanged ahead of the opening bell in Asia, returning to the sub-1.1900 region following a firmer tone in the US Dollar. Indeed, the pair reverses two consecutive daily gains amid steady caution ahead of Wednesday’s key US Nonfarm Payrolls release.
 

GBP/USD slips back to daily lows near 1.3640

GBP/USD drops to daily lows near 1.3640 as sellers push harder and the Greenback extends its rebound in the latter part of Tuesday’s session. Looking ahead, the combination of key US releases, including NFP and CPI, alongside important UK data, should keep the pound firmly in focus over the coming days.

Gold the battle of wills continues with bulls not ready to give up

Gold remains on the defensive and approaches the key $5,000 region per troy ounce on Tuesday, giving back part of its recent two day. The precious metal’s pullback unfolds against a firmer tone in the US Dollar, declining US Treasury yields and steady caution ahead of upcoming key US data releases.

Bitcoin's downtrend caused by ETF redemptions and AI rotation: Wintermute

Bitcoin's (BTC) fall from grace since the October 10 leverage flush has been spearheaded by sustained ETF outflows and a rotation into the AI narrative, according to Wintermute.

Dollar drops and stocks rally: The week of reckoning for US economic data

Following a sizeable move lower in US technology Stocks last week, we have witnessed a meaningful recovery unfold. The USD Index is in a concerning position; the monthly price continues to hold the south channel support.

XRP holds $1.40 amid ETF inflows and stable derivatives market

Ripple trades under pressure, with immediate support at $1.40 holding at the time of writing on Tuesday. A recovery attempt from last week’s sell-off to $1.12 stalled at $1.54 on Friday, leading to limited price action between the current support and the resistance.