USD/INR Technical Analysis: 100-day MA is key resistance


The USD/INR pair closed at 71.44 on Feb. 1, confirming a bull flag breakout. The 100-day moving average (MA), however, has put the brakes on the post-breakout rally.

Daily chart

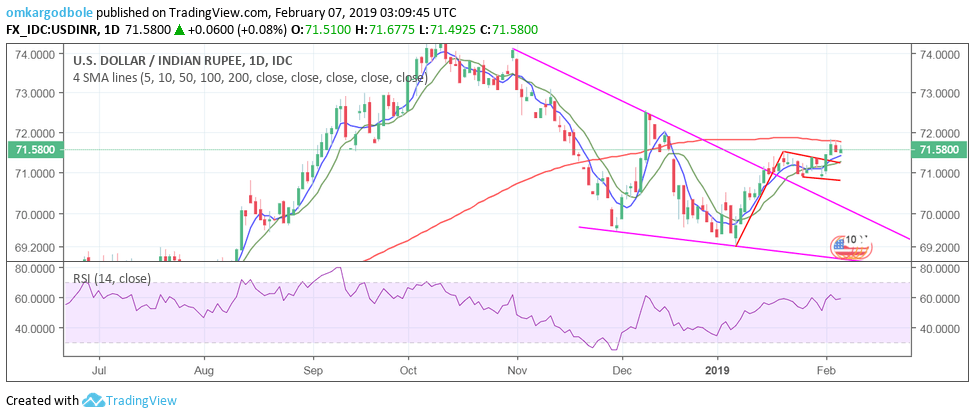
The back-to-back failure to penetrate the 100-day MA on a closing basis is a slight cause for concern. The outlook, however, remains bullish while the pair is held above the former resistance-turned-support of 71.38 (Jan. 29 high).

With 5- and 10-day moving averages (MAs) trending north, dips to 71.38, if any, could be short-lived.

A close above the 100-day MA of 71.78 would bolster the already bullish setup and open up upside toward 72.55. Note that the 14-day RSI is located at 58, meaning there is sufficient room for a convincing move above 72.00.

India' Nifty index has found acceptance above the crucial resistance of 11,000. The stocks, therefore, could remain better bid, providing some support to INR.

Trend: cautiously bullish

USD/INR

Overview:
    Today Last Price: 71.675
    Today Daily change: 0.0950 pips
    Today Daily change %: 0.13%
    Today Daily Open: 71.58
Trends:
    Daily SMA20: 71.1083
    Daily SMA50: 70.7616
    Daily SMA100: 71.7746
    Daily SMA200: 70.352
Levels:
    Previous Daily High: 71.78
    Previous Daily Low: 71.475
    Previous Weekly High: 71.64
    Previous Weekly Low: 70.82
    Previous Monthly High: 71.64
    Previous Monthly Low: 69.185
    Daily Fibonacci 38.2%: 71.6635
    Daily Fibonacci 61.8%: 71.5915
    Daily Pivot Point S1: 71.4433
    Daily Pivot Point S2: 71.3067
    Daily Pivot Point S3: 71.1383
    Daily Pivot Point R1: 71.7483
    Daily Pivot Point R2: 71.9167
    Daily Pivot Point R3: 72.0533


Share: Feed news

Information on these pages contains forward-looking statements that involve risks and uncertainties. Markets and instruments profiled on this page are for informational purposes only and should not in any way come across as a recommendation to buy or sell in these assets. You should do your own thorough research before making any investment decisions. FXStreet does not in any way guarantee that this information is free from mistakes, errors, or material misstatements. It also does not guarantee that this information is of a timely nature. Investing in Open Markets involves a great deal of risk, including the loss of all or a portion of your investment, as well as emotional distress. All risks, losses and costs associated with investing, including total loss of principal, are your responsibility. The views and opinions expressed in this article are those of the authors and do not necessarily reflect the official policy or position of FXStreet nor its advertisers. The author will not be held responsible for information that is found at the end of links posted on this page.

If not otherwise explicitly mentioned in the body of the article, at the time of writing, the author has no position in any stock mentioned in this article and no business relationship with any company mentioned. The author has not received compensation for writing this article, other than from FXStreet.

FXStreet and the author do not provide personalized recommendations. The author makes no representations as to the accuracy, completeness, or suitability of this information. FXStreet and the author will not be liable for any errors, omissions or any losses, injuries or damages arising from this information and its display or use. Errors and omissions excepted.

The author and FXStreet are not registered investment advisors and nothing in this article is intended to be investment advice.

Recommended content


Recommended content

Editors’ Picks

EUR/USD retreats below 1.0700 after US GDP data

EUR/USD retreats below 1.0700 after US GDP data

EUR/USD came under modest bearish pressure and retreated below 1.0700. Although the US data showed that the economy grew at a softer pace than expected in Q1, strong inflation-related details provided a boost to the USD.

EUR/USD News

GBP/USD declines below 1.2500 as USD rebounds

GBP/USD declines below 1.2500 as USD rebounds

GBP/USD declined below 1.2500 and erased the majority of its daily gains with the immediate reaction to the US GDP report. The US economy expanded at a softer pace than expected in Q1 but the price deflator jumped to 3.4% from 1.8%. 

GBP/USD News

Gold drops below $2,320 as US yields shoot higher

Gold drops below $2,320 as US yields shoot higher

Gold lost its traction and turned negative on the day below $2,320 in the American session on Thursday. The benchmark 10-year US Treasury bond yield is up more than 1% on the day above 4.7% after US GDP report, weighing on XAU/USD.

Gold News

XRP extends its decline, crypto experts comment on Ripple stablecoin and benefits for XRP Ledger

XRP extends its decline, crypto experts comment on Ripple stablecoin and benefits for XRP Ledger

Ripple extends decline to $0.52 on Thursday, wipes out weekly gains. Crypto expert asks Ripple CTO how the stablecoin will benefit the XRP Ledger and native token XRP. 

Read more

After the US close, it’s the Tokyo CPI

After the US close, it’s the Tokyo CPI

After the US close, it’s the Tokyo CPI, a reliable indicator of the national number and then the BoJ policy announcement. Tokyo CPI ex food and energy in Japan was a rise to 2.90% in March from 2.50%.

Read more

Forex MAJORS

Cryptocurrencies

Signatures