USD/INR remains under selling pressure ahead of US PMI data
- Indian Rupee trades firmer on Thursday.
- The first reading of India’s HSBC PMI was mixed in May.
- Investors will closely monitor the preliminary US PMI data for May, which is due on Thursday.

Indian Rupee (INR) recovers some lost ground on Thursday following the mixed Indian Purchasing Managers Index (PMI) reports. The nation’s HSBC Manufacturing PMI dropped to 58.4 in May from 58.5 in April, while the Services PMI figure improved to 61.4 in May from the previous reading of 60.8. Furthermore, the potential foreign exchange intervention from the Reserve Bank of India (RBI) might cap the INR’s weakness in the near term.
However, the hawkish stance from the FOMC Minutes and the Federal Reserve (Fed) policymakers might boost the Greenback and create a tailwind for the pair. The foreign outflows ahead of India's upcoming election outcome might also weigh on the INR. Market players will keep an eye on the preliminary US S&P Global PMI on Thursday. In case the report shows a stronger-than-estimated reading, this might delay the timing of a rate cut cycle, underpinning the US Dollar (USD).
Daily Digest Market Movers: Indian Rupee gathers strength despite the Fed’s hawkish stance
- Food prices remain high in India and may keep inflation elevated, according to the Reserve Bank of India's (RBI) latest ‘State of the economy’ report.
- Foreign investors sold Indian equities worth more than $3 billion in May, the biggest monthly outflow since January 2023.
- The FOMC released the minutes of the April 30 - May 1 policy meeting on Wednesday, indicating that inflation in recent months had shown a lack of further progress toward the Fed’s 2% objective.”
- The Fed policymakers are likely to keep its benchmark rate unchanged at least until September after their confidence in lowering price pressures was eroded by higher-than-expected inflation in the first three months of the year.
- Financial markets continue to adjust their expectations for rate cuts this year, with nearly a 60% chance of the first reduction in September, according to the CME FedWatch tool.
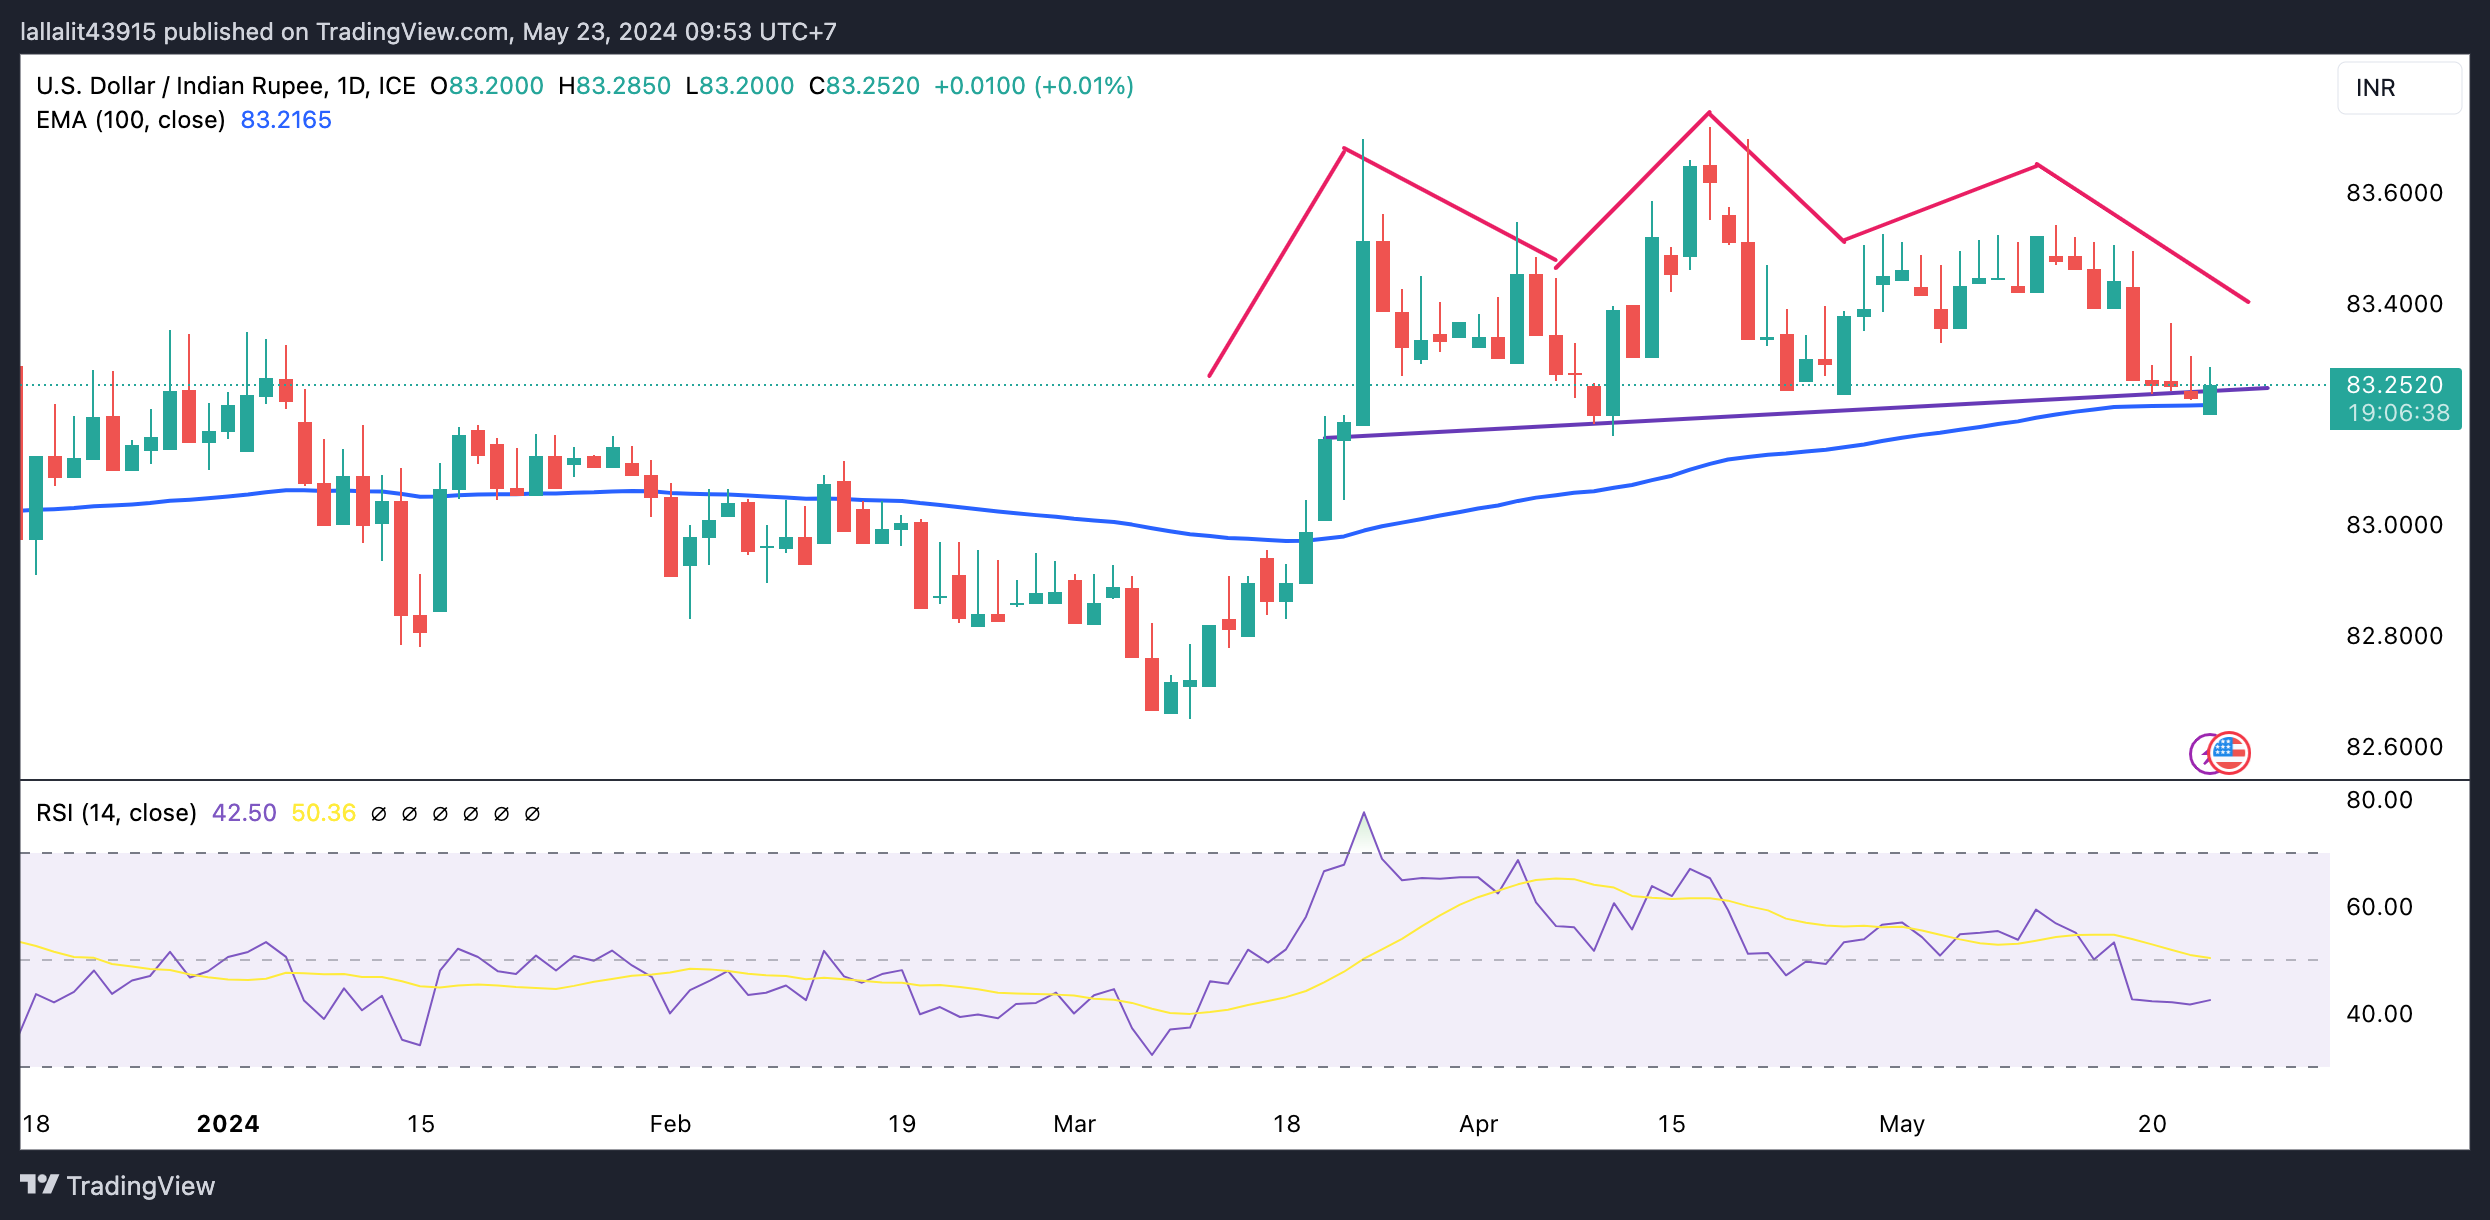
Technical analysis: USD/INR’s positive picture seems fragile on the daily chart
The Indian Rupee trades on a stronger note on the day. The USD/INR pair has formed the Head and Shoulders pattern since March 21. The bullish outlook of the pair seems vulnerable as the pair hovers around the key 100-day Exponential Moving Average (EMA) and the neckline on the daily chart. A cross below this level will resume its downtrend, with the 14-day Relative Strength Index (RSI) holding below the 50-midline.
The 83.20–83.25 regions act as a crucial support level for USD/INR, portraying the confluence of the 100-day EMA and the neckline. A breach of this level will see a drop to the 83.00 psychological mark, followed by a low of January 15 at 82.78.
On the bright side, the first upside target will emerge at the right shoulder of the Head and Shoulders pattern of 83.54 (high of May 13). A bullish breakout above the mentioned level would end up invalidating the chart pattern and see a rally to a high of April 17 at 83.72, en route to 84.00.
US Dollar price in the last 7 days
The table below shows the percentage change of US Dollar (USD) against listed major currencies in the last 7 days. US Dollar was the strongest against the Swiss Franc.
| USD | EUR | GBP | CAD | AUD | JPY | NZD | CHF | |
| USD | 0.57% | -0.28% | 0.60% | 1.13% | 1.50% | 0.27% | 1.57% | |
| EUR | -0.58% | -0.84% | 0.03% | 0.58% | 0.94% | -0.31% | 1.00% | |
| GBP | 0.28% | 0.84% | 0.88% | 1.42% | 1.77% | 0.54% | 1.83% | |
| CAD | -0.61% | -0.03% | -0.89% | 0.55% | 0.91% | -0.34% | 0.95% | |
| AUD | -1.16% | -0.58% | -1.44% | -0.56% | 0.36% | -0.90% | 0.42% | |
| JPY | -1.51% | -0.93% | -1.79% | -0.92% | -0.32% | -1.27% | 0.04% | |
| NZD | -0.25% | 0.31% | -0.54% | 0.34% | 0.90% | 1.24% | 1.30% | |
| CHF | -1.60% | -1.01% | -1.87% | -0.97% | -0.42% | -0.05% | -1.32% |
The heat map shows percentage changes of major currencies against each other. The base currency is picked from the left column, while the quote currency is picked from the top row. For example, if you pick the Euro from the left column and move along the horizontal line to the Japanese Yen, the percentage change displayed in the box will represent EUR (base)/JPY (quote).
Indian Rupee FAQs
The Indian Rupee (INR) is one of the most sensitive currencies to external factors. The price of Crude Oil (the country is highly dependent on imported Oil), the value of the US Dollar – most trade is conducted in USD – and the level of foreign investment, are all influential. Direct intervention by the Reserve Bank of India (RBI) in FX markets to keep the exchange rate stable, as well as the level of interest rates set by the RBI, are further major influencing factors on the Rupee.
The Reserve Bank of India (RBI) actively intervenes in forex markets to maintain a stable exchange rate, to help facilitate trade. In addition, the RBI tries to maintain the inflation rate at its 4% target by adjusting interest rates. Higher interest rates usually strengthen the Rupee. This is due to the role of the ‘carry trade’ in which investors borrow in countries with lower interest rates so as to place their money in countries’ offering relatively higher interest rates and profit from the difference.
Macroeconomic factors that influence the value of the Rupee include inflation, interest rates, the economic growth rate (GDP), the balance of trade, and inflows from foreign investment. A higher growth rate can lead to more overseas investment, pushing up demand for the Rupee. A less negative balance of trade will eventually lead to a stronger Rupee. Higher interest rates, especially real rates (interest rates less inflation) are also positive for the Rupee. A risk-on environment can lead to greater inflows of Foreign Direct and Indirect Investment (FDI and FII), which also benefit the Rupee.
Higher inflation, particularly, if it is comparatively higher than India’s peers, is generally negative for the currency as it reflects devaluation through oversupply. Inflation also increases the cost of exports, leading to more Rupees being sold to purchase foreign imports, which is Rupee-negative. At the same time, higher inflation usually leads to the Reserve Bank of India (RBI) raising interest rates and this can be positive for the Rupee, due to increased demand from international investors. The opposite effect is true of lower inflation.
Author

Lallalit Srijandorn
FXStreet
Lallalit Srijandorn is a Parisian at heart. She has lived in France since 2019 and now becomes a digital entrepreneur based in Paris and Bangkok.


