|

USD/INR Price News: Monthly support break favors Indian Rupee buyers near 82.70

  • USD/INR renews intraday low, after four-week uptrend, on technical breakdown.
  • Downbeat oscillators add strength to the fall targeting 100-SMA, 200-SMA.
  • Weekly descending trend line adds to the upside filters.

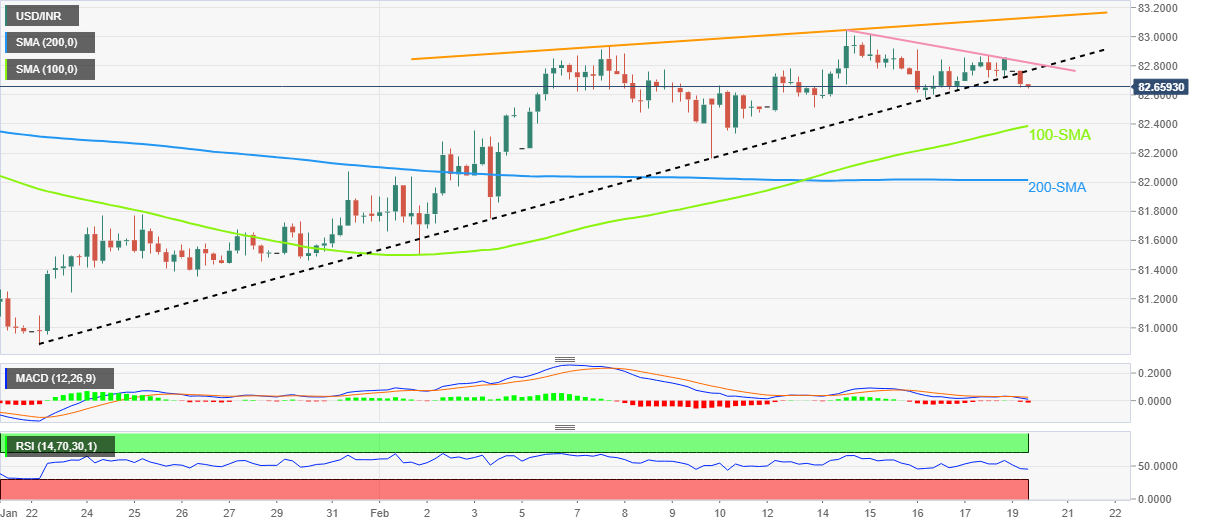
USD/INR takes offers to refresh intraday low near 82.65 during the initial Indian trading session on Monday.

In doing so, the Indian Rupee (INR) pair justifies the early day’s downside break of a one-month-old ascending trend line to print the first daily loss after witnessing four consecutive weeks of a run-up.

Not only the trend line breakdown but the bearish MACD signals and the downbeat RSI (14), not oversold, also signals the INR pair’s further downside towards the 100-SMA, close to 82.40 by the press time.

However, the 200-SMA level surrounding the 82.00 round figure could challenge the USD/INR bears afterward.

In a case where the USD/INR pair remains bearish past the 82.00 threshold, the late January’s swing high near 81.80 could act as the last defense of the pair buyers.

On the flip side, recovery moves need to cross the previous support line from January 23, close to 82.75, to recall the USD/INR buyers.

Even so, a one-week-old descending trend line could challenge the recovery moves near the 82.85 hurdle.

Should the USD/INR bulls remain dominant past 82.85, an upward-sloping resistance line from February 07, close to 83.15 at the latest, may lure the pair buyers.

Overall, USD/INR is likely to decline further but the downside room appears limited.

USD/INR: Four-hour chart

Trend: Further downside expected

Additional important levels

Overview
Today last price82.654
Today Daily Change-0.2024
Today Daily Change %-0.24%
Today daily open82.8564
 
Trends
Daily SMA2082.2115
Daily SMA5082.2536
Daily SMA10082.1089
Daily SMA20080.6291
 
Levels
Previous Daily High82.8701
Previous Daily Low82.6275
Previous Weekly High83.0456
Previous Weekly Low82.4892
Previous Monthly High83.072
Previous Monthly Low80.8822
Daily Fibonacci 38.2%82.7774
Daily Fibonacci 61.8%82.7202
Daily Pivot Point S182.6992
Daily Pivot Point S282.5421
Daily Pivot Point S382.4567
Daily Pivot Point R182.9418
Daily Pivot Point R283.0272
Daily Pivot Point R383.1844

Author

Anil Panchal

Anil Panchal

FXStreet

Anil Panchal has nearly 15 years of experience in tracking financial markets. With a keen interest in macroeconomics, Anil aptly tracks global news/updates and stays well-informed about the global financial moves and their implications.

More from Anil Panchal
Share:

Markets move fast. We move first.

Orange Juice Newsletter brings you expert driven insights - not headlines. Every day on your inbox.

By subscribing you agree to our Terms and conditions.

Editor's Picks

EUR/USD off three-month highs, holds near 1.1800 on softer US Dollar

EUR/USD consolidates gains below 1.1800 in the European trading hours on Wednesday. A broadly subdued US Dollar continues to underpin the pair amid quiet markets and thin liquidity conditions on Christmas Eve. 

GBP/USD keeps range around 1.3500 amid quiet markets

GBP/USD keeps its range trade intact at around 1.3500 in the European session on Wednesday. The Pound Sterling holds the upper hand over the US Dollar amid pre-Christmas light trading as traders turn to sidelines heading into the holiday season. 

Gold retreats from record highs amid profit-taking on Christmas Eve

Gold retreats following the move higher to the $4,525 area, or a fresh all-time peak, though the downside remains limited amid a bullish fundamental backdrop. The US Dollar selling bias remains unabated on the back of dovish Fed expectations, which continues to act as a tailwind for the bullion amid persistent geopolitical risks.

Shiba Inu's bears tighten grip, aiming for yearly lows

Shiba Inu price remains under pressure, trading below $0.000070 on Wednesday as bearish momentum continues to dominate the broader crypto market. On-chain and derivatives data further support the bearish sentiment, while technical analysis suggests a deeper correction targeting the yearly lows.

Economic outlook 2026-2027 in advanced countries: Solidity test

After a year marked by global economic resilience and ending on a note of optimism, 2026 looks promising and could be a year of solid economic performance. In our baseline scenario, we expect most of the supportive factors at work in 2025 to continue to play a role in 2026.

Stellar Price Forecast: XLM slips below $0.22 as bearish momentum builds

Stellar (XLM) price is trading below $0.22 at the time of writing on Wednesday after failing to close above the key resistance earlier this week. Bearish momentum continues to strengthen, with open interest falling and short bets rising.