USD/INR Price News: Indian rupee bulls seem tiring inside short-term triangle below 73.00
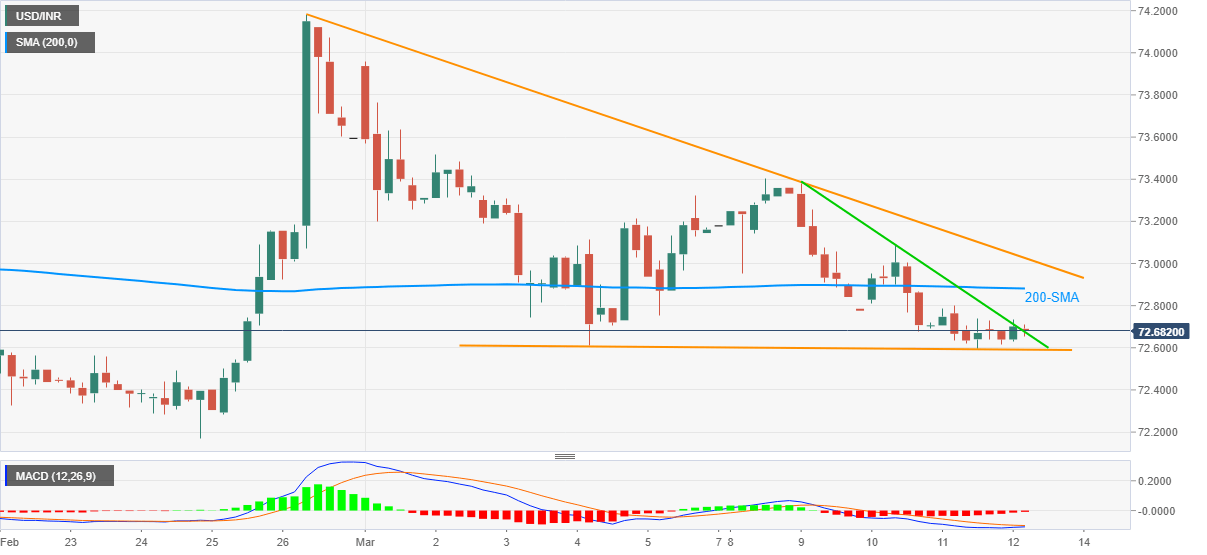
- USD/INR wavers around weekly low, tests two-week-old triangle support.
- MACD fares bearish bias, break of immediate resistance line favor corrective pullback.
- Bulls need to cross triangle’s resistance line for conviction.

USD/INR takes rounds to 72.70 while looking for a clear direction amid the initial Indian trading session on Friday. In doing so, the quote remains inside a 15-pip range established in the last two days while also testing the support line of a descending triangle formed since February 26.
It should, however, be noted that a clear break of a three-day-long falling trend line and receding bearish bias of the MACD signals suggests USD/INR bounce off towards the key SMA level around 72.90.
If at all the USD/INR buyers manage to cross 72.88, the stated triangle’s upper line close to 73.05 will be the key to watch for the USD/INR buyers. Though, sustained trading beyond the same should be a call to the bulls targeting 73.40 and the late February top near 74.20.
Alternatively, a downside break of 72.60 support line will eye the 72.00 threshold but the multi-month low, marked last month, around 72.20 can offer an intermediate halt during the fall.
Overall, USD/INR seems to lack further ammunition to back the bears, which in turn gives rise to hopes of a short-covering move.
USD/INR four-hour chart
Trend: Pullback expected
Author

Anil Panchal
FXStreet
Anil Panchal has nearly 15 years of experience in tracking financial markets. With a keen interest in macroeconomics, Anil aptly tracks global news/updates and stays well-informed about the global financial moves and their implications.


