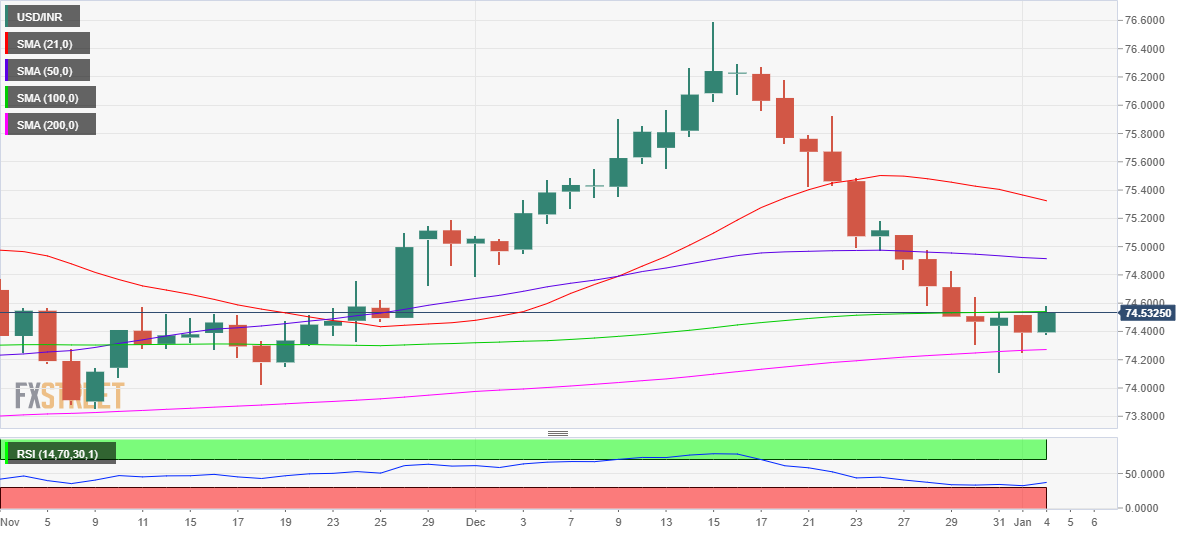
- USD/INR attempts a rebound as the DXY capitalizes on firmer yields.
- Acceptance above 100-DMA is critical for USD/INR buyers.
- Daily technical setup suggests a pullback before a fresh downswing kicks in.
USD/INR is posting sizeable gains in the European session this Tuesday, reversing the entire drop seen Monday.
The rebound in the pair can be attributed to the notable US dollar demand, courtesy of the sharp rally in the US Treasury bond yields.
The US yields jumped in tandem with the coronavirus cases globally while rising odds of a March Fed rate hike also helped fuel the upswing.
The upbeat sentiment around oil prices weighed negatively on the Indian rupee, in turn, collaborating with the upturn in the spot.
At the time of writing, the spot is trading close to the daily highs of 74.58, looking to find acceptance above the 100-Daily Moving Average (DMA) at 74.50.
The 14-day Relative Strength Index (RSI) is bouncing from near the oversold region, boding well for bulls, as they attempt a rebound.
The December 30 highs of 74.64 will be next on the buyers’ radars should the price close above the 100-DMA on a daily basis.
USD/INR: Daily chart
On the other hand, the bulls remain hopeful for recovery so long as the cross holds above the ascending 200-DMA at 74.27.
The downtrend from mid-December peaks of 76.59 will resume on a sustained move below the latter, exposing December 31 lows of 74.10.
Deeper declines will see a test of the 73.50 psychological levels.
USD/INR: Additional levels
Information on these pages contains forward-looking statements that involve risks and uncertainties. Markets and instruments profiled on this page are for informational purposes only and should not in any way come across as a recommendation to buy or sell in these assets. You should do your own thorough research before making any investment decisions. FXStreet does not in any way guarantee that this information is free from mistakes, errors, or material misstatements. It also does not guarantee that this information is of a timely nature. Investing in Open Markets involves a great deal of risk, including the loss of all or a portion of your investment, as well as emotional distress. All risks, losses and costs associated with investing, including total loss of principal, are your responsibility. The views and opinions expressed in this article are those of the authors and do not necessarily reflect the official policy or position of FXStreet nor its advertisers. The author will not be held responsible for information that is found at the end of links posted on this page.
If not otherwise explicitly mentioned in the body of the article, at the time of writing, the author has no position in any stock mentioned in this article and no business relationship with any company mentioned. The author has not received compensation for writing this article, other than from FXStreet.
FXStreet and the author do not provide personalized recommendations. The author makes no representations as to the accuracy, completeness, or suitability of this information. FXStreet and the author will not be liable for any errors, omissions or any losses, injuries or damages arising from this information and its display or use. Errors and omissions excepted.
The author and FXStreet are not registered investment advisors and nothing in this article is intended to be investment advice.
Recommended content
Editors’ Picks
EUR/USD holds gains above 1.0700, as key US data loom

EUR/USD holds gains above 1.0700 in the European session on Thursday. Renewed US Dollar weakness offsets the risk-off market environment, supporting the pair ahead of the key US GDP and PCE inflation data.
GBP/USD extends recovery above 1.2500, awaits US GDP data

GBP/USD is catching a fresh bid wave, rising above 1.2500 in European trading on Thursday. The US Dollar resumes its corrective downside, as traders resort to repositioning ahead of the high-impact US advance GDP data for the first quarter.
Gold price edges higher amid weaker USD and softer risk tone, focus remains on US GDP

Gold price (XAU/USD) attracts some dip-buying in the vicinity of the $2,300 mark on Thursday and for now, seems to have snapped a three-day losing streak, though the upside potential seems limited.
XRP extends its decline, crypto experts comment on Ripple stablecoin and benefits for XRP Ledger

Ripple extends decline to $0.52 on Thursday, wipes out weekly gains. Crypto expert asks Ripple CTO how the stablecoin will benefit the XRP Ledger and native token XRP.
US Q1 GDP Preview: Economic growth set to remain firm in, albeit easing from Q4

The United States Gross Domestic Product (GDP) is seen expanding at an annualized rate of 2.5% in Q1. The current resilience of the US economy bolsters the case for a soft landing.
