|

USD/INR Price Analysis: Sticks to modest intraday gains above 83.00 amid stronger USD

  • USD/INR catches fresh bids on Monday and draws support from a bullish USD.
  • Neutral oscillators on the daily chart warrant some caution for bullish traders.
  • Any meaningful slide might continue to attract fresh buyers and remain limited.

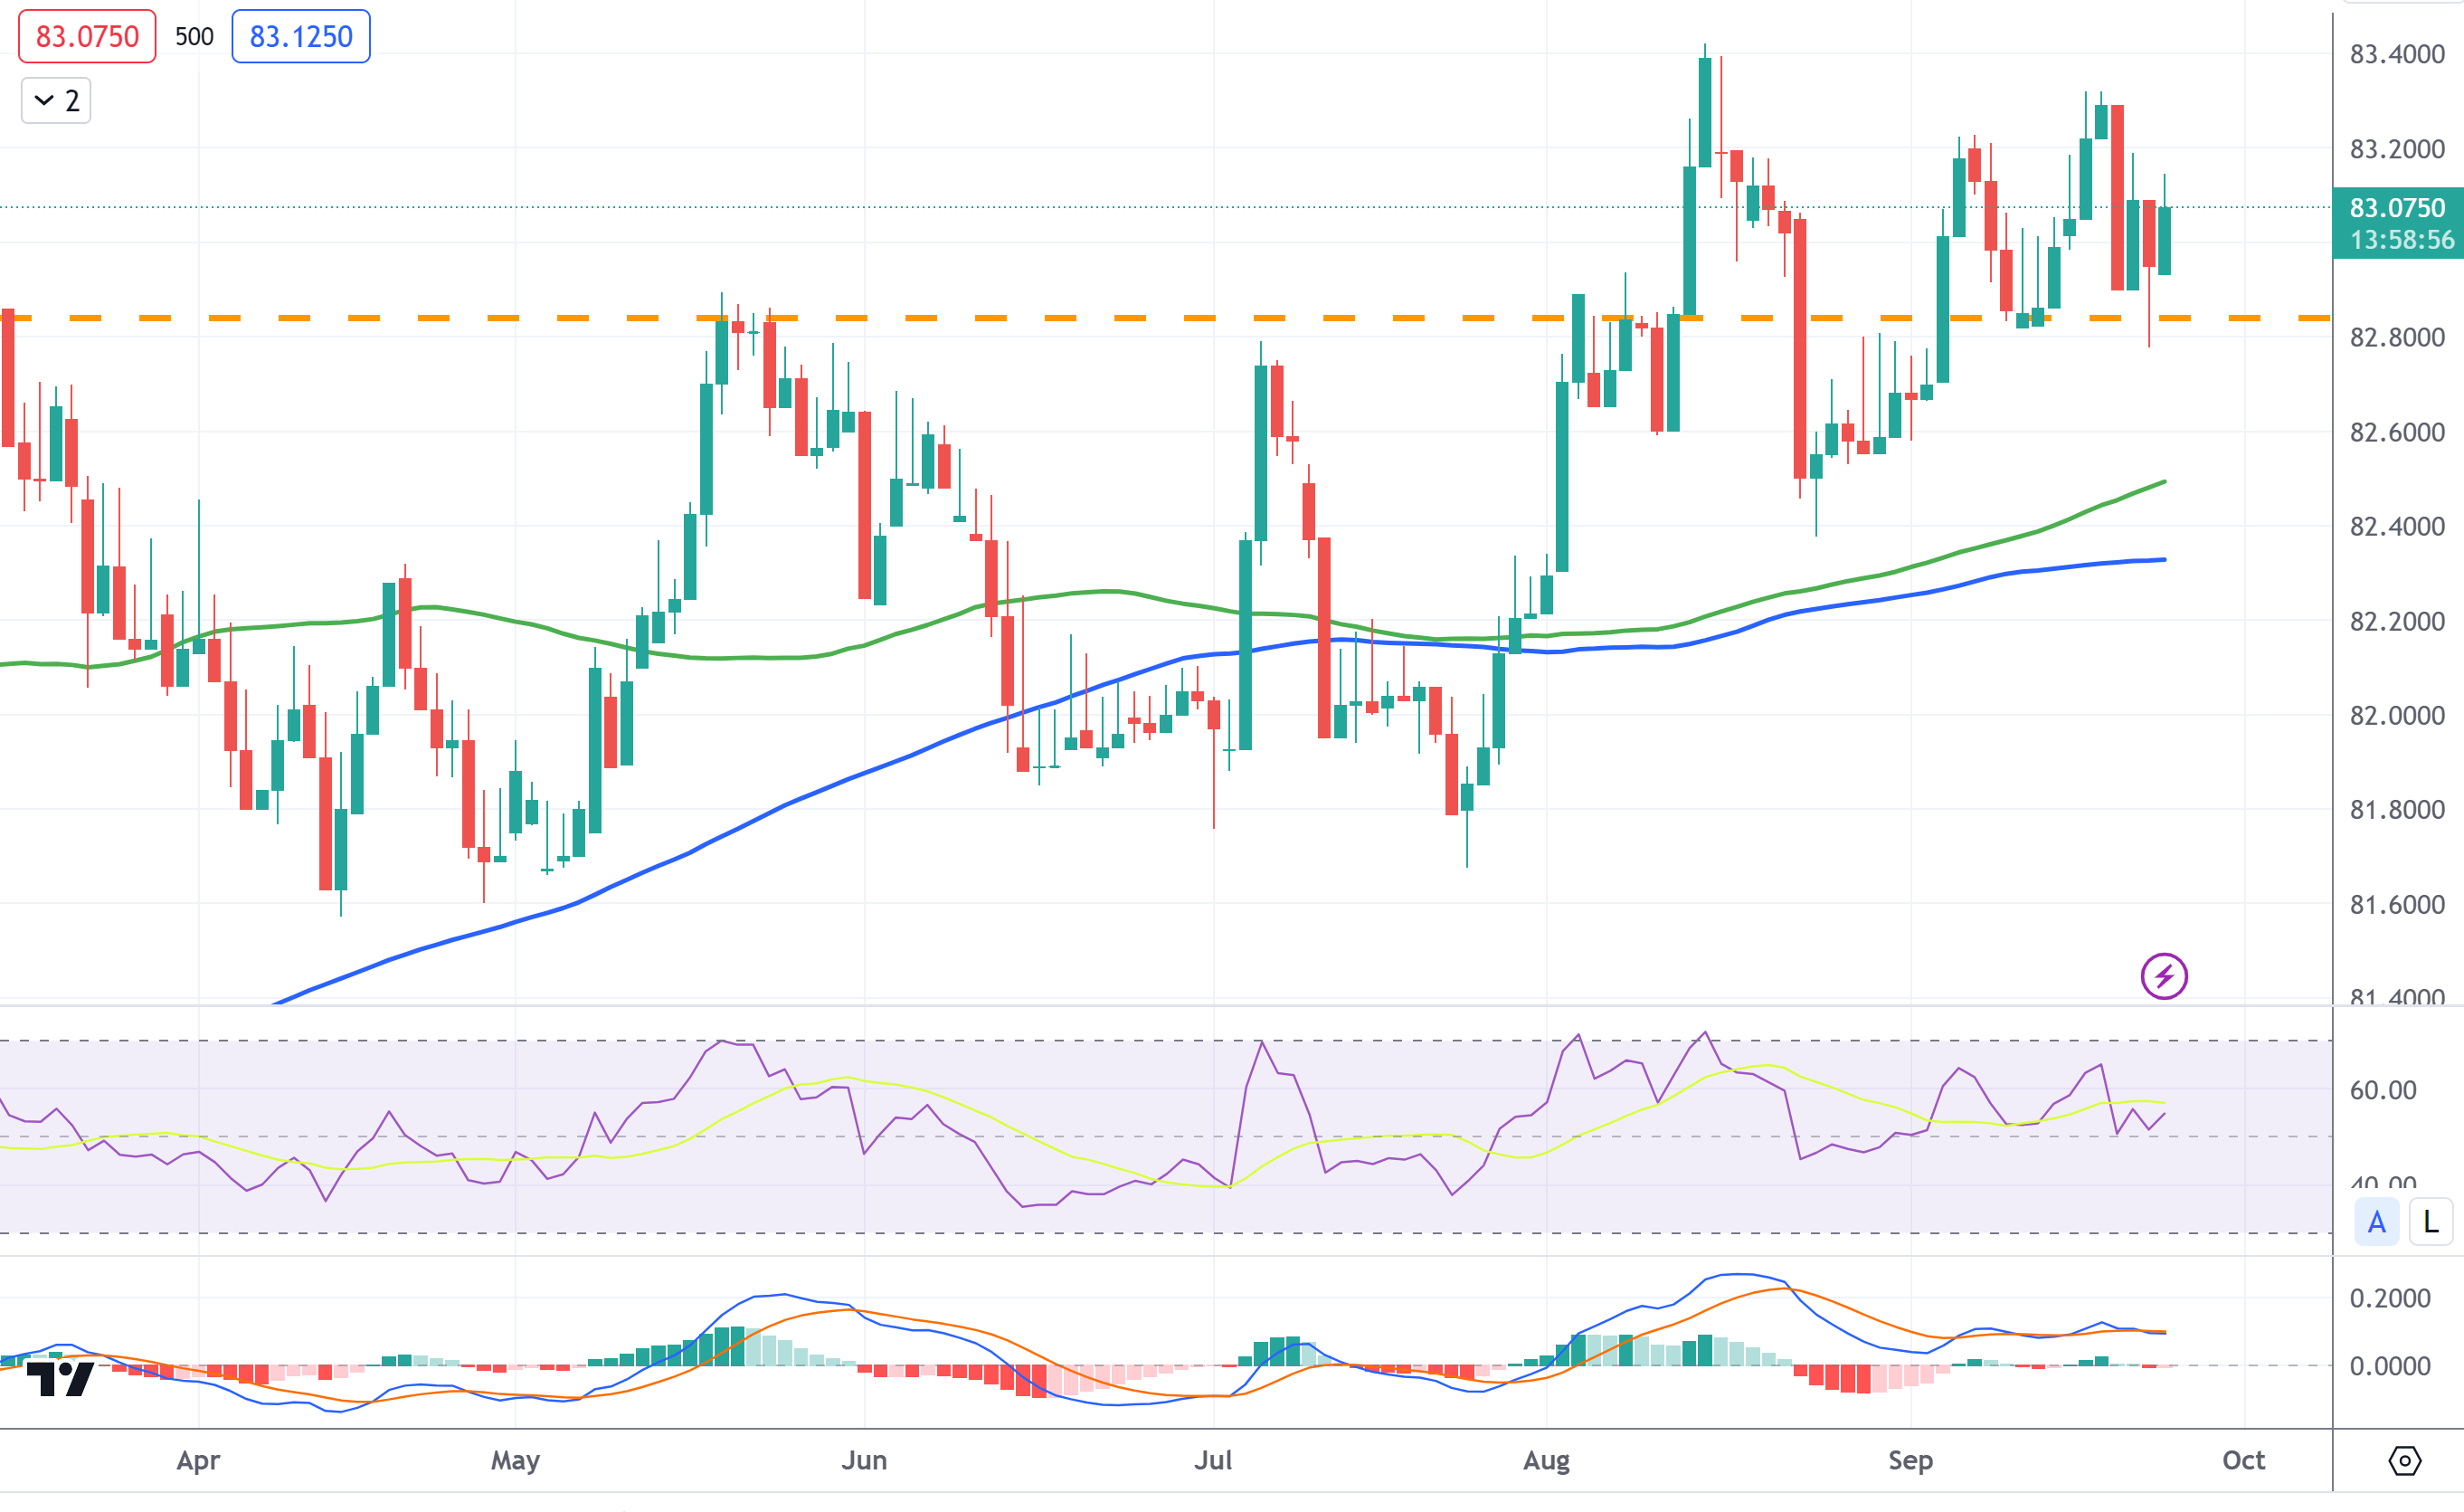
The USD/INR pair regains positive traction on the first day of a new week and moves away from a nearly three-week low, around the 82.80-82.75 region touched on Friday. Spot prices stick to intraday gains through the early part of the European session and currently trade above the 83.00 round-figure mark.

The prospects for further policy tightening by the Federal Reserve (Fed) remain supportive of elevated US Treasury bond yields and assist the US Dollar (USD) to hold steady near its highest level in more than six months. Apart from this, persistent worries about a property market crisis in China further benefit the Greenback's relative safe-haven status and act as a tailwind for the USD/INR pair.

From a technical perspective, neutral oscillators on the daily chart warrant some caution before positioning for further intraday appreciating move. Hence, any subsequent strength is likely to confront resistance near the 82.30 zone ahead of the all-time peak, around the 83.40-83.45 region touched on August 15, which if cleared decisively should allow the USD/INR pair to conquer the 84.00 round figure.

On the flip side, the 82.80-82.75 region, or Friday's swing low should protect the immediate downside. This is closely followed by the upward-sloping 100-day Simple Moving Average (SMA), currently pegged near the mid-82.00s, and the 200-day SMA, around the 82.35 region. The latter should act as a key pivotal point for the USD/INR pair and a convincing break below will be seen as a fresh trigger for bears.

Spot prices might then turn vulnerable to accelerate the slide towards the 82.00 mark. The downward trajectory could get extended further and eventually drag the USD/INR pair to the July swing low, around the 81.70-81.65 region.

USD/INR daily chart

Technical levels to watch

USD/INR

Overview
Today last price83.1125
Today Daily Change0.0160
Today Daily Change %0.02
Today daily open83.0965
 
Trends
Daily SMA2082.9933
Daily SMA5082.762
Daily SMA10082.5335
Daily SMA20082.3614
 
Levels
Previous Daily High83.2444
Previous Daily Low82.5125
Previous Weekly High83.8456
Previous Weekly Low82.5125
Previous Monthly High83.5505
Previous Monthly Low82.224
Daily Fibonacci 38.2%82.7921
Daily Fibonacci 61.8%82.9648
Daily Pivot Point S182.6579
Daily Pivot Point S282.2193
Daily Pivot Point S381.926
Daily Pivot Point R183.3897
Daily Pivot Point R283.683
Daily Pivot Point R384.1216

Author

Haresh Menghani

Haresh Menghani is a detail-oriented professional with 10+ years of extensive experience in analysing the global financial markets.

More from Haresh Menghani
Share:

Markets move fast. We move first.

Orange Juice Newsletter brings you expert driven insights - not headlines. Every day on your inbox.

By subscribing you agree to our Terms and conditions.

Editor's Picks

EUR/USD gathers recovery momentum, trades near 1.1750

Following the correction seen in the second half of the previous week, EUR/USD gathers bullish momentum and trades in positive territory near 1.1750. The US Dollar (USD) struggles to attract buyers and supports the pair as investors await Tuesday's GDP data ahead of the Christmas holiday. 

GBP/USD knocks ten-week highs ahead of holiday slowdown

GBP/USD found room on the high side on Monday, kicking off a holiday-shortened trading week with a fresh spat of Greenback weakness, bolstering the Pound Sterling into its highest bids in ten weeks. Pound traders are largely brushing off the latest interest rate cut from the Bank of England as the UK’s central bank policy strategy leaves the water murky for rate-cut watchers.

Gold buying remains unabated; fresh all-time peak and counting

Gold builds on the previous day's blowout rally through the $4,400 mark and continues scaling new record highs through the Asian session on Tuesday. Bets for more interest rate cuts by the US Fed, renewed US Dollar selling bias, and rising geopolitical uncertainties turn out to be key factors driving flows towards the bullion. Traders now look to the delayed release of the revised US Q3 GDP print and US Durable Goods Orders for a fresh impetus.

Year ahead 2026: Where will Bitcoin be in a year’s time?

Bitcoin, which accounts for roughly 60% of total crypto market capitalization, entered 2025 with unstoppable momentum under a crypto‑friendly Trump administration. The rally was supported by major regulatory wins and accelerating institutional adoption.

Ten questions that matter going into 2026

2026 may be less about a neat “base case” and more about a regime shift—the market can reprice what matters most (growth, inflation, fiscal, geopolitics, concentration). The biggest trap is false comfort: the same trades can look defensive… right up until they become crowded.

XRP steadies above $1.90 support as fund inflows and retail demand rise

Ripple (XRP) is stable above support at $1.90 at the time of writing on Monday, after several attempts to break above the $2.00 hurdle failed to materialize last week. Meanwhile, institutional interest in the cross-border remittance token has remained steady.