USD/INR Price Analysis: MACD teases Indian rupee bears around 79.65


  • USD/INR remains sidelined between 20-DMA support and monthly resistance line.
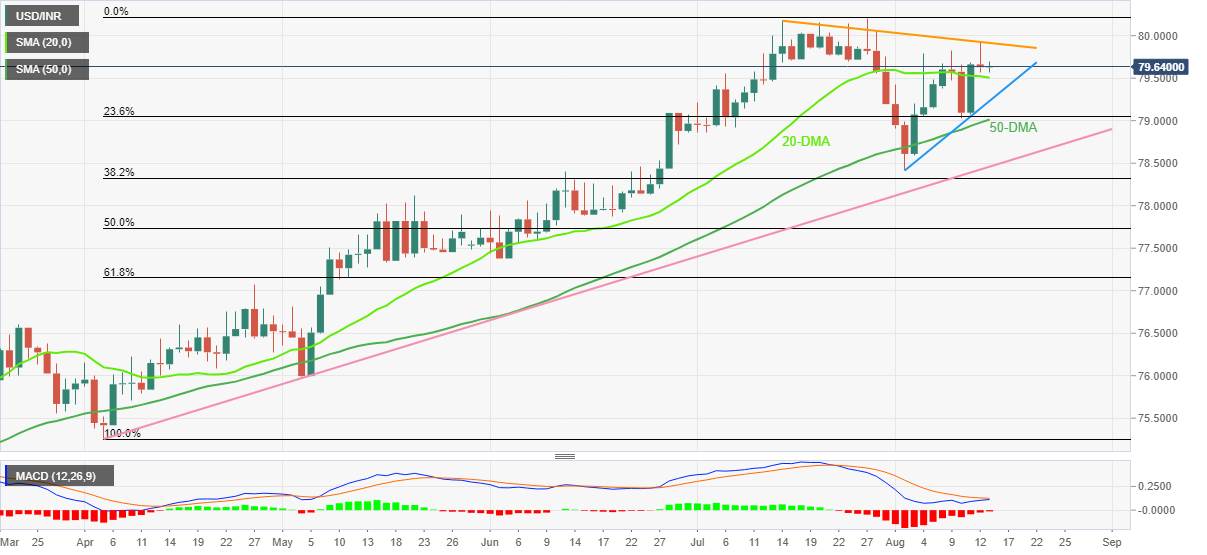
  • Impending bull cross on MACD suggests further grinding towards the north.
  • Fortnight-old support line, 50-DMA restricts short-term downside.
  • A successful break of 80.00 appears necessary for buyers’ conviction.

USD/INR extends the previous day’s reversal from a two-week-old hurdle while taking rounds to 79.60-65 during the early Monday morning in Europe. Even so, the 20-DMA defends the Indian rupee (INR) sellers while the looming bull cross on the MACD teases the pair buyers.

That said, the quote’s recent weakness aims for the 20-DMA support of 79.50, a break of which could direct the USD/INR sellers towards the fortnight-old support line near 79.20.

Following that, the 50-DMA and an upward sloping support line from April, respectively near 79.00 and 78.45, will be crucial for the pair bears to watch. It’s worth observing that the monthly low of 78.40 acts as an extra filter to the south.

Alternatively, the USD/INR rebound needs to cross the aforementioned resistance line, at 79.90 by the press time, to convince buyers.

However, successful trading beyond the 80.00 psychological magnet appears necessary for the pair bulls to keep reins. In that case, the latest peak of 80.20 will be on the bull’s radar as an immediate hurdle.

Overall, USD/INR grinds higher with multiple filters that challenge the bears.

USD/INR: Daily chart

Trend: Further upside expected

Additional important levels

Overview
Today last price 79.5825
Today Daily Change -0.0464
Today Daily Change % -0.06%
Today daily open 79.6289
 
Trends
Daily SMA20 79.5231
Daily SMA50 78.9773
Daily SMA100 77.8547
Daily SMA200 76.4857
 
Levels
Previous Daily High 79.9355
Previous Daily Low 79.5652
Previous Weekly High 79.9355
Previous Weekly Low 79.0255
Previous Monthly High 80.208
Previous Monthly Low 78.8583
Daily Fibonacci 38.2% 79.7066
Daily Fibonacci 61.8% 79.794
Daily Pivot Point S1 79.4842
Daily Pivot Point S2 79.3395
Daily Pivot Point S3 79.1138
Daily Pivot Point R1 79.8546
Daily Pivot Point R2 80.0802
Daily Pivot Point R3 80.2249


Share: Feed news

Information on these pages contains forward-looking statements that involve risks and uncertainties. Markets and instruments profiled on this page are for informational purposes only and should not in any way come across as a recommendation to buy or sell in these assets. You should do your own thorough research before making any investment decisions. FXStreet does not in any way guarantee that this information is free from mistakes, errors, or material misstatements. It also does not guarantee that this information is of a timely nature. Investing in Open Markets involves a great deal of risk, including the loss of all or a portion of your investment, as well as emotional distress. All risks, losses and costs associated with investing, including total loss of principal, are your responsibility. The views and opinions expressed in this article are those of the authors and do not necessarily reflect the official policy or position of FXStreet nor its advertisers. The author will not be held responsible for information that is found at the end of links posted on this page.

If not otherwise explicitly mentioned in the body of the article, at the time of writing, the author has no position in any stock mentioned in this article and no business relationship with any company mentioned. The author has not received compensation for writing this article, other than from FXStreet.

FXStreet and the author do not provide personalized recommendations. The author makes no representations as to the accuracy, completeness, or suitability of this information. FXStreet and the author will not be liable for any errors, omissions or any losses, injuries or damages arising from this information and its display or use. Errors and omissions excepted.

The author and FXStreet are not registered investment advisors and nothing in this article is intended to be investment advice.

Recommended content


Recommended content

Editors’ Picks

AUD/USD remained bid above 0.6500

AUD/USD remained bid above 0.6500

AUD/USD extended further its bullish performance, advancing for the fourth session in a row on Thursday, although a sustainable breakout of the key 200-day SMA at 0.6526 still remain elusive.

AUD/USD News

EUR/USD faces a minor resistance near at 1.0750

EUR/USD faces a minor resistance near at 1.0750

EUR/USD quickly left behind Wednesday’s small downtick and resumed its uptrend north of 1.0700 the figure, always on the back of the persistent sell-off in the US Dollar ahead of key PCE data on Friday.

EUR/USD News

Gold holds around $2,330 after dismal US data

Gold holds around $2,330 after dismal US data

Gold fell below $2,320 in the early American session as US yields shot higher after the data showed a significant increase in the US GDP price deflator in Q1. With safe-haven flows dominating the markets, however, XAU/USD reversed its direction and rose above $2,340.

Gold News

Bitcoin price continues to get rejected from $65K resistance as SEC delays decision on spot BTC ETF options

Bitcoin price continues to get rejected from $65K resistance as SEC delays decision on spot BTC ETF options

Bitcoin (BTC) price has markets in disarray, provoking a broader market crash as it slumped to the $62,000 range on Thursday. Meanwhile, reverberations from spot BTC exchange-traded funds (ETFs) continue to influence the market.

Read more

US economy: slower growth with stronger inflation

US economy: slower growth with stronger inflation

The dollar strengthened, and stocks fell after statistical data from the US. The focus was on the preliminary estimate of GDP for the first quarter. Annualised quarterly growth came in at just 1.6%, down from the 2.5% and 3.4% previously forecast.

Read more

Forex MAJORS

Cryptocurrencies

Signatures