|

USD/INR Price Analysis: Indian Rupee sellers need validation from 82.55

  • USD/INR extends the previous day’s rebound from 10-week-old ascending support line.
  • Upside break of 200-SMA, firmer but not overbought RSI favor Indian Rupee sellers.
  • Convergence of 13-day-old resistance line, 23.6% Fibonacci retracement challenges USD/INR bulls.

USD/INR prints the biggest daily gains in more than two weeks as it rises to 82.45 during early Monday.

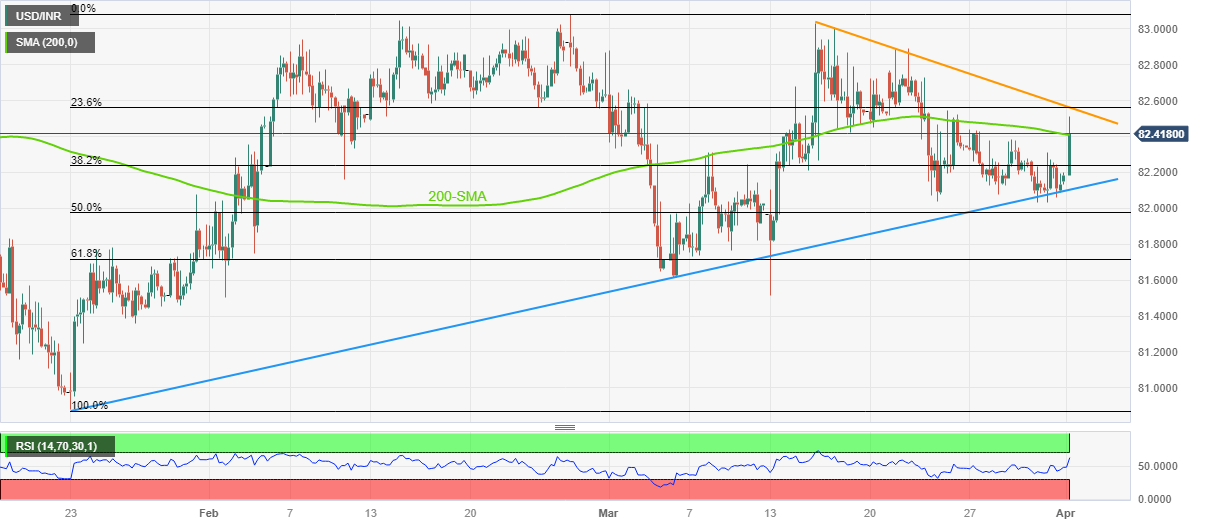
In doing so, the Indian Rupee (INR) pair justifies the previous day’s rebound from a 2.5-month-long ascending support line while crossing the 200-bar Simple Moving Average (SMA).

It’s worth noting that the firmer RSI (14) line, not overbought, also underpins the bullish bias about the USD/INR pair.

However, a convergence of the downward-sloping resistance line from mid-March joins the 23.6% Fibonacci retracement level of the pair’s January-February upside to highlight the 82.55 level as a tough nut to crack for the USD/INR bulls.

Should the Indian Rupee pair remains firmer past 82.55 hurdle, a quick run-up toward the 83.00 round figure can’t be ruled out. Though, the yearly high of around 83.10, as well as the record top of 83.42 marked in October 2022, could challenge the pair’s further upside.

Alternatively, pullback moves remain elusive unless the quote offers decisive trading below the 200-bar SMA level surrounding 82.40.

Even so, the USD/INR bears are likely to remain cautious beyond the aforementioned multi-day-old support line, close to 82.10 by the press time.

In a case where the Indian Rupee buyers break the 82.10 support, the odds of witnessing a slump toward the 61.8% Fibonacci retracement level and then toward the previous monthly low, respectively near 81.70 and 81.50, can be expected.

USD/INR: Four-hour chart

Trend: Limited upside expected

Additional important levels

Overview
Today last price82.4309
Today Daily Change0.2503
Today Daily Change %0.30%
Today daily open82.1806
 
Trends
Daily SMA2082.2891
Daily SMA5082.3139
Daily SMA10082.1764
Daily SMA20081.3183
 
Levels
Previous Daily High82.3122
Previous Daily Low82.034
Previous Weekly High82.441
Previous Weekly Low82.03
Previous Monthly High83.0315
Previous Monthly Low81.512
Daily Fibonacci 38.2%82.2059
Daily Fibonacci 61.8%82.1403
Daily Pivot Point S182.0391
Daily Pivot Point S281.8975
Daily Pivot Point S381.7609
Daily Pivot Point R182.3172
Daily Pivot Point R282.4538
Daily Pivot Point R382.5954

Author

Anil Panchal

Anil Panchal

FXStreet

Anil Panchal has nearly 15 years of experience in tracking financial markets. With a keen interest in macroeconomics, Anil aptly tracks global news/updates and stays well-informed about the global financial moves and their implications.

More from Anil Panchal
Share:

Editor's Picks

EUR/USD stays well offered below 1.1800

The selling pressure on EUR/USD is picking up pace, with the pair slipping decisively below the key 1.1800 level and sliding to fresh two week lows as Wednesday’s session draws to a close. The move lower comes as the US Dollar finds renewed strength after the latest round of US data and the release of the FOMC Minutes. Next of note on the docket will be the US weekly Initial Jobless Claims.
 

GBP/USD reaches multi-day lows near 1.3500

GBP/USD reverses its initial upside momentum and is now adding to previous declines, approaching the 1.3500 region on Wednesday. Cable’s downtick comes on the back of decent gains in the Greenback and easing UK inflation figures, which seem to have reinforced the case for a BoE rate cut in March.

Gold battle to regain $5,000 continues

Gold is back on the front foot on Wednesday, shaking off part of the early week softness and challenging two-day highs near the $5,000 mark per troy ounce. The move comes ahead of the FOMC Minutes and is unfolding despite an intense rebound in the US Dollar.

Bitcoin has found or is near a bottom, extended consolidation to follow: K33

Bitcoin (BTC) is nearing or has already established a bottom, which could be followed by a sustained period of slow price movement, according to K33.

Mixed UK inflation data no gamechanger for the Bank of England

Food inflation plunged in January, but service sector price pressure is proving stickier. We continue to expect Bank of England rate cuts in March and June. The latest UK inflation read is a mixed bag for the Bank of England, but we doubt it drastically changes the odds of a March rate cut.

Sui extends sideways action ahead of Grayscale’s GSUI ETF launch

Sui is extending its downtrend for the second consecutive day, trading at 0.95 at the time of writing on Wednesday. The Layer-1 token is down over 16% in February and approximately 34% from the start of the year, aligning with the overall bearish sentiment across the crypto market.