USD/INR Price Analysis: Holds comfortably above 83.00, eyes all-time high ahead of FOMC


Share:
  • USD/INR struggles to gain any meaningful traction and oscillates in a range on Tuesday.
  • The technical setup favours bulls and supports prospects for a further appreciating move.
  • Any meaningful corrective decline is more likely to get bought into and remain limited.

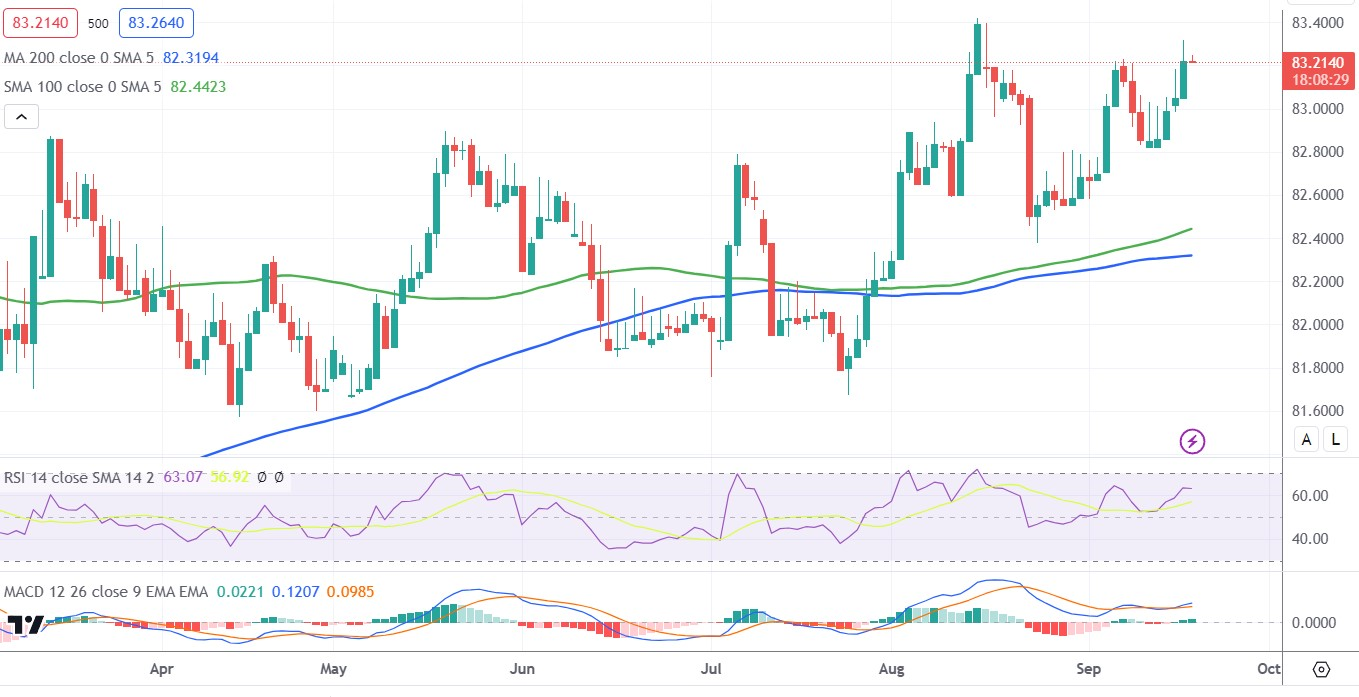
The USD/INR pair oscillates in a range around the 83.20-83.25 area during the Asian session on Tuesday and remains well within the striking distance of over a one-month high touched the previous day. The technical setup, meanwhile, still seems tilted in favour of bullish traders and suggests that the path of least resistance for spot prices is to the upside.

The positive bias is reinforced by the fact that the USD/INR pair is holding comfortably above technically significant 100-day and 200-day Simple Moving Averages (SMAs). Moreover, technical indicators on the daily chart have been gaining some positive traction and are still far from being in the overbought territory. This, in turn, validates the constructive outlook and supports prospects for an extension of the recent upward trajectory witnessed over the past week or so.

Hence, a subsequent strength back towards challenging the all-time high, around the 83.45 region touched in August, looks like a distinct possibility. Some follow-through buying will be seen as a fresh trigger for bulls and allow the USD/INR pair to conquer the 84.00 round-figure mark. Bulls, however, might refrain from placing aggressive bets and prefer to wait on the sidelines ahead of the crucial FOMC monetary policy decision, scheduled to be announced on Wednesday.

On the flip side, any meaningful corrective slide might now find decent support near the 83.00 level and bought into near last week's swing low, around the 82.80 area. This is followed by the 100-day, currently around the 82.45 region, ahead of the 200-day SMA near the 82.30 zone. A convincing break below the said support levels might prompt some technical selling and make the USD/INR pair vulnerable to accelerate the downward trajectory towards the 82.00 round figure.

The USD/INR pair could slide further towards the July monthly swing low, around the 81.70-81.65 region. Failure to defend the latter will suggest that spot prices have topped out in the near term and pave the way for deeper losses. The pair might then weaken further below the 81.35 intermediate support and eventually drop towards testing sub-81.00 levels.

USD/INR daily chart

Technical levels to watch

USD/INR

Overview
Today last price 83.2371
Today Daily Change -0.0011
Today Daily Change % -0.00
Today daily open 83.2382
 
Trends
Daily SMA20 82.9017
Daily SMA50 82.6816
Daily SMA100 82.4781
Daily SMA200 82.3506
 
Levels
Previous Daily High 83.3495
Previous Daily Low 83.055
Previous Weekly High 83.2896
Previous Weekly Low 82.5035
Previous Monthly High 83.5505
Previous Monthly Low 82.224
Daily Fibonacci 38.2% 83.237
Daily Fibonacci 61.8% 83.1675
Daily Pivot Point S1 83.079
Daily Pivot Point S2 82.9197
Daily Pivot Point S3 82.7844
Daily Pivot Point R1 83.3735
Daily Pivot Point R2 83.5088
Daily Pivot Point R3 83.6681


Share: Feed news

Information on these pages contains forward-looking statements that involve risks and uncertainties. Markets and instruments profiled on this page are for informational purposes only and should not in any way come across as a recommendation to buy or sell in these assets. You should do your own thorough research before making any investment decisions. FXStreet does not in any way guarantee that this information is free from mistakes, errors, or material misstatements. It also does not guarantee that this information is of a timely nature. Investing in Open Markets involves a great deal of risk, including the loss of all or a portion of your investment, as well as emotional distress. All risks, losses and costs associated with investing, including total loss of principal, are your responsibility. The views and opinions expressed in this article are those of the authors and do not necessarily reflect the official policy or position of FXStreet nor its advertisers. The author will not be held responsible for information that is found at the end of links posted on this page.

If not otherwise explicitly mentioned in the body of the article, at the time of writing, the author has no position in any stock mentioned in this article and no business relationship with any company mentioned. The author has not received compensation for writing this article, other than from FXStreet.

FXStreet and the author do not provide personalized recommendations. The author makes no representations as to the accuracy, completeness, or suitability of this information. FXStreet and the author will not be liable for any errors, omissions or any losses, injuries or damages arising from this information and its display or use. Errors and omissions excepted.

The author and FXStreet are not registered investment advisors and nothing in this article is intended to be investment advice.

Follow us on Telegram

Stay updated of all the news

Join Telegram

Recommended content


Follow us on Telegram

Stay updated of all the news

Join Telegram

Recommended content

Editors’ Picks

EUR/USD loses traction, retreats below 1.0600

EUR/USD loses traction, retreats below 1.0600

EUR/USD lost its recovery momentum and declined below 1.0600 in the American session on Friday, erasing a portion of its daily gains in the process. Nevertheless, the risk-positive market atmosphere after PCE inflation data helps the pair limit its losses.

EUR/USD News

GBP/USD turns negative on the day below 1.2200

GBP/USD turns negative on the day below 1.2200

GBP/USD reversed its direction and slumped below 1.2200 in the American session on Friday after rising above 1.2270 earlier in the day. Position readjustments and profit-taking on the last trading day of the quarter seems to be weighing on Pound Sterling.

GBP/USD News

Gold reverses direction, drops below $1,860

Gold reverses direction, drops below $1,860

Following a steady rebound toward $1,880 on Friday, Gold price made a sharp U-turn and turned negative on the day near $1,860. Although the 10-year US T-bond yield is down more than 1%, XAU/USD struggles to find demand on the last day of Q3.

Gold News

Polkadot Price Forecast: DOT reversal seems inevitable after 92% correction from all-time high

Polkadot Price Forecast: DOT reversal seems inevitable after 92% correction from all-time high

Polkadot price, in nearly two years, has shed 92.91% from its all-time high of $55.09. The massive downswing in DOT has pushed it down to levels that were last seen in October 2020. Hence, the chances of this altcoin forming a bottom and rallying are high. 

Read more

Earnings beat triggers Nike to spike 9%

Earnings beat triggers Nike to spike 9%

Nike (NKE) stock has surged over 9% in Friday’s premarket, climbing above $98 per share, following late Thursday’s fiscal first-quarter earnings release. Nike beat pessimistic earnings expectations by more than 23% and hiked its dividend by 9%.

Read more

Forex MAJORS

Cryptocurrencies

Signatures