|

USD/INR Price Analysis: Climbs to 83.20-25 area, back closer to monthly swing high

  • USD/INR scales higher for the second straight day and touches a multi-day top on Tuesday.
  • The technical setup warrants some caution for bulls and before positioning for further gains.
  • Any corrective decline towards the 83.00 mark could now be seen as a buying opportunity.

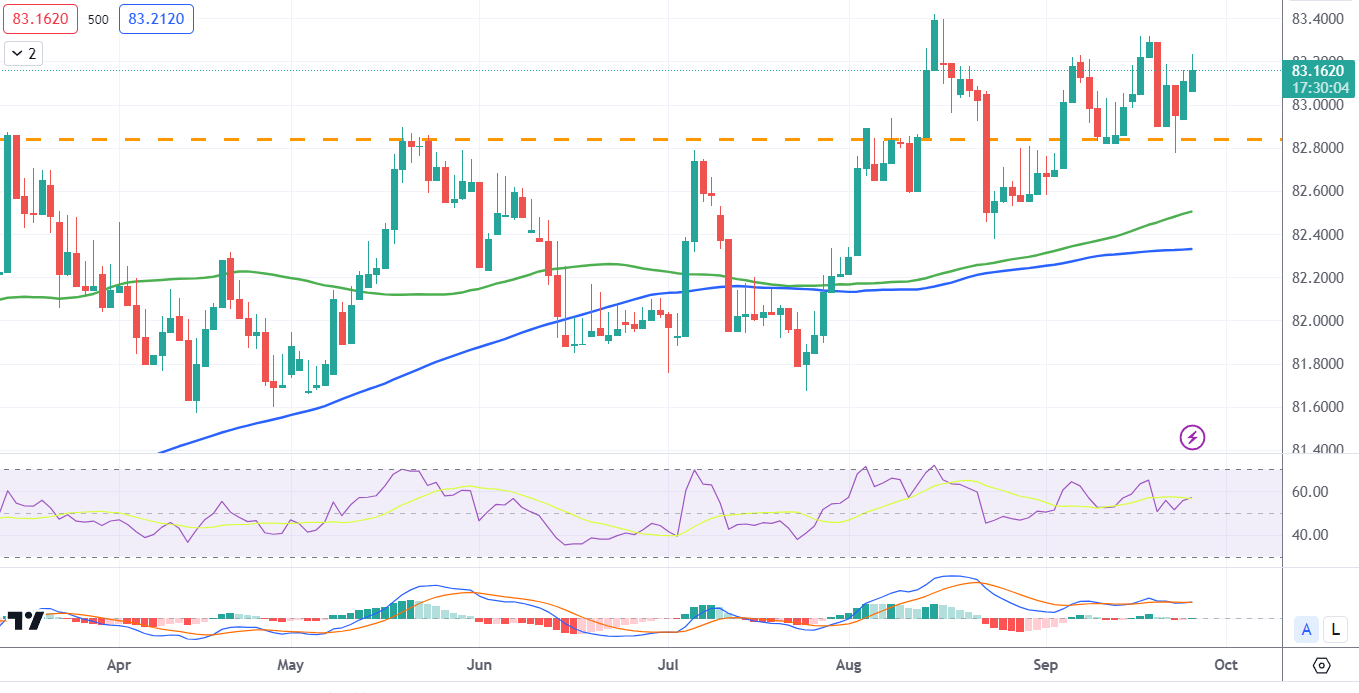
The USD/INR pair gains some positive traction for the second successive day on Tuesday and climbs to a multi-day peak during the Asian session. Spot prices currently trade around the 83.20 area, up 0.15% for the day, and remain well within the striking distance of the monthly peak touched last week.

The prospects for further policy tightening by the Federal Reserve (Fed) continue to push the US Treasury bond yields higher and underpin the US Dollar (USD). Apart from this, the risk-off impulse – as depicted by a weaker tone around the equity markets – assists the safe-haven Greenback to stand tall near its highest level since December 2022 touched on Monday. This, in turn, is seen as a key factor that continues to act as a tailwind for the USD/INR pair.

From a technical perspective, oscillators on the daily chart are yet to gain any meaningful positive traction and warrant caution for aggressive bullish traders. Hence, it will be prudent to wait for some follow-through buying beyond the 82.30 area, or the monthly top, before positioning for further appreciating move. The USD/INR pair might then surpass the all-time peak, around the 83.40-83.45 region touched on August 15, and aim to conquer the 84.00 round figure.

On the flip side, any corrective decline might now find some support near the 83.00 mark ahead of Friday's swing low, around the 82.80-82.75 region. This is closely followed by the upward-sloping 100-day Simple Moving Average (SMA), currently pegged near the mid-82.00s, and the 200-day SMA, around the 82.35 region. The latter should act as a key pivotal point for the USD/INR pair, which if broken decisively will be seen as a fresh trigger for bearish traders.

Spot prices might then turn vulnerable to accelerate the downfall towards the 82.00 mark. The downward trajectory could get extended further and eventually drag the USD/INR pair to the July swing low, around the 81.70-81.65 region.

USD/INR daily chart

Techincal levels to watch

USD/INR

Overview
Today last price83.1865
Today Daily Change0.1100
Today Daily Change %0.13
Today daily open83.0765
 
Trends
Daily SMA2083.0096
Daily SMA5082.7822
Daily SMA10082.5464
Daily SMA20082.3638
 
Levels
Previous Daily High83.2529
Previous Daily Low82.975
Previous Weekly High83.8456
Previous Weekly Low82.5125
Previous Monthly High83.5505
Previous Monthly Low82.224
Daily Fibonacci 38.2%83.0812
Daily Fibonacci 61.8%83.1468
Daily Pivot Point S182.9501
Daily Pivot Point S282.8236
Daily Pivot Point S382.6722
Daily Pivot Point R183.2279
Daily Pivot Point R283.3793
Daily Pivot Point R383.5058

Author

Haresh Menghani

Haresh Menghani is a detail-oriented professional with 10+ years of extensive experience in analysing the global financial markets.

More from Haresh Menghani
Share:

Editor's Picks

EUR/USD edges lower below 1.1650 as Middle East tensions fuel US Dollar strength

The EUR/USD pair trades in negative territory around 1.1635 during the early Asian session on Thursday. The US Dollar strengthens against the Euro as escalating Middle East conflict boosts safe-haven flows. Traders brace for the Eurozone Retail Sales and US weekly Initial Jobless Claims reports, which will be released later on Thursday. 

GBP/USD tests key moving averages as growth downgrade weighs

GBP/USD was nearly flat on Wednesday, edging up 0.08% to settle around 1.3370 in a quiet session. The pair has fallen sharply from its late-January high near 1.3870 and is now testing the 200-day Exponential Moving Average, with this week's one-week forex heatmap showing Pound Sterling as one of the worst performers against the US Dollar, down about 1.4% on the week.

Gold benefits from a retreating USD; reduced Fed rate cut bets cap gains

Gold attracts some buyers for the second consecutive day on Thursday amid a modest US Dollar pullback from an over three-month high, though it remains below the $5,200 mark. Wednesday's upbeat US macro data further tempered hopes for three rate cuts by the Fed in 2026. Furthermore, escalating Middle East tensions might continue to benefit the USD's status as the global reserve currency and contribute to capping the bullion.

Morgan Stanley files amended S-1 for spot Bitcoin ETF

Morgan Stanley submitted an amended S-1 filing to the US Securities and Exchange Commission on Wednesday, providing additional details on its proposed Bitcoin exchange-traded fund.

First Venezuela, now Iran: The US-China energy war escalates

At first glance, the latest escalation involving the United States with both Iran and Venezuela looks like another chapter in a long-running geopolitical story. But viewed through a broader strategic lens, something else may be unfolding: Energy.

Bittensor extends recovery despite retail demand slump

Bittensor, a leading Artificial Intelligence token, is aging up above $190 at the time of writing on Wednesday. Steady price increases characterise the broader crypto market, with Bitcoin holding above $71,000 and Ethereum above $2,000.