|

USD/INR Price Analysis: Bulls have the upper hand, could aim to test all-time peak near 83.45

  • USD/INR is seen consolidating in a narrow band just above the 83.00 mark.
  • The technical setup favours bulls and supports prospects for additional gains.
  • Any meaningful corrective slide is likely to get bought into and remain limited.

The USD/INR pair struggles to capitalize on its modest gains registered over the past two days and oscillates in a narrow range through the Asian session on Friday. Spot prices currently trade just above the 83.00 mark and the setup suggests that the path of least resistance is to the upside.

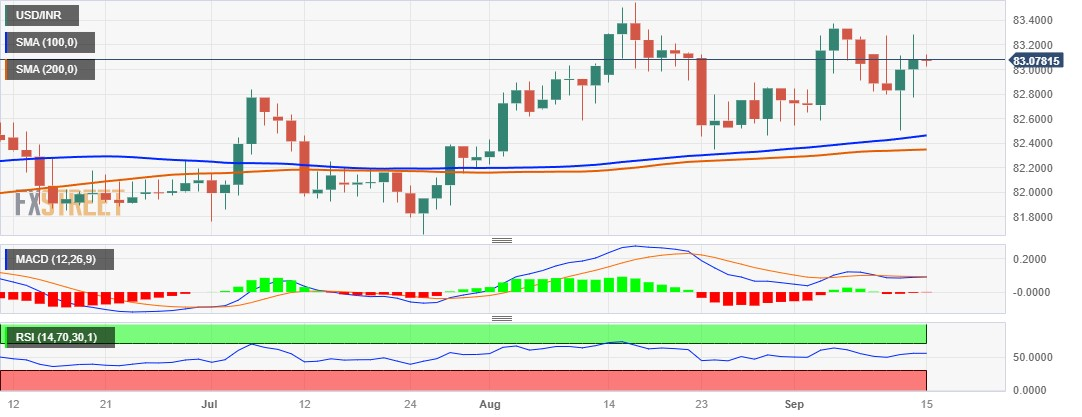
The positive outlook is reinforced by the fact that the USD/INR pair is holding comfortably above technically significant 100-day and 200-day Simple Moving Averages (SMAs). Moreover, positive oscillators on the daily chart – though have been losing traction – favour bullish traders and validate the near-term positive outlook. Hence, some follow-through strength beyond last week's swing high, around the 83.20-83.25 region, en route to the record high, around the 83.45 region touched in August, looks like a distinct possibility.

On the flip side, any meaningful slide might continue to find some support near the 82.80 area or the weekly low. This is followed by the 100-day and the 200-day SMAs confluence, currently pegged around the 82.45-82.35 region, which should act as a pivotal point. A convincing break below might prompt some technical selling and make the USD/INR pair vulnerable to accelerate the slide to the 82.00 mark.

The downward trajectory could get extended further towards the July monthly swing low, around the 81.70-81.65 region. Failure to defend the said support levels will suggest that USD/INR has topped out in the near term and pave the way for a meaningful corrective decline. Spot prices might then weaken towards the 81.35 intermediate support before eventually dropping towards testing sub-81.00 levels.

USD/INR daily chart

fxsoriginal

Technical levels to watch

USD/INR

Overview
Today last price83.0397
Today Daily Change-0.0389
Today Daily Change %-0.05
Today daily open83.0786
 
Trends
Daily SMA2082.8992
Daily SMA5082.6596
Daily SMA10082.4494
Daily SMA20082.3447
 
Levels
Previous Daily High83.2896
Previous Daily Low82.7745
Previous Weekly High83.3714
Previous Weekly Low82.585
Previous Monthly High83.5505
Previous Monthly Low82.224
Daily Fibonacci 38.2%83.0928
Daily Fibonacci 61.8%82.9712
Daily Pivot Point S182.8055
Daily Pivot Point S282.5325
Daily Pivot Point S382.2905
Daily Pivot Point R183.3206
Daily Pivot Point R283.5626
Daily Pivot Point R383.8356

Author

Haresh Menghani

Haresh Menghani is a detail-oriented professional with 10+ years of extensive experience in analysing the global financial markets.

More from Haresh Menghani
Share:

Editor's Picks

EUR/USD eyes nine-day EMA barrier after rebounding from 1.1600

EUR/USD gains ground after registering modest losses in the previous session, trading around 1.1620 during the Asian hours on Friday. The technical analysis of the daily chart suggests an ongoing bearish bias as the pair remains within the descending channel pattern.

GBP/USD: Pound Sterling ticks up against US Dollar in countdown to US NFP

The Pound Sterling trades marginally higher to near 1.3365 against the US Dollar during the Asian trading session on Friday. The GBP/USD pair edges up as the US Dollar ticks down ahead of the United States Nonfarm Payrolls data for February, which will be published at 13:30 GMT.

Gold awaits US Nonfarm Payrolls for a clear directional impetus

Gold rebounds above $5,100 early Friday after testing the $5,050 level amid global sell-off. The US Dollar pulls back as profit-taking creeps in ahead of US labor data. For February. 21-day SMA holds amid bullish RSI; a daily closing above 61.8% Fibo is critical for Gold buyers.

Top Crypto Gainers: Lombard, Humanity Protocol, OKB rally on US Fed’s tokenized securities clarity, NYSE investment

Lombard, Humanity Protocol, and OKB rally over the last 24 hours, securing the top-gainer spots in the early Asian session. The US Federal Reserve issued clarity on tokenized securities, which expands its utility and reduces regulatory friction with US banks, driving the Real-World Assets tokenization crypto projects. 

The market compass is pointing at a barrel of Oil

The Asian open is arriving with equities leaning the wrong way, and the reason is not complicated. The market’s compass needle has snapped firmly toward crude. In this tape, oil is not just another input price; it is the gravitational center around which every asset class is orbiting.

Ripple tests recovery strength amid steady ETF inflows, growing retail interest

Ripple (XRP) continues to demonstrate notable resilience as the cryptocurrency market navigates the persistent war in the Middle East after the United States (US) and Israel attacked Iran on Saturday.