|

USD/INR Price Analysis: Bears not ready to give up yet, 200-day SMA holds the key

  • USD/INR edges lower on Friday and extends the overnight pullback from a two-week high.
  • The technical setup still favours bearish traders and supports prospects for additional losses.
  • Some follow-through buying beyond the 82.25 area is needed to negate the negative outlook.

The USD/INR pair edges lower during the Asian session on Friday and moves further away from a two-week high, around the 82.25 region touched the previous day. Spot prices, however, manage to hold above the 82.00 mark and remain confined in a familiar trading band held over the past two weeks or so.

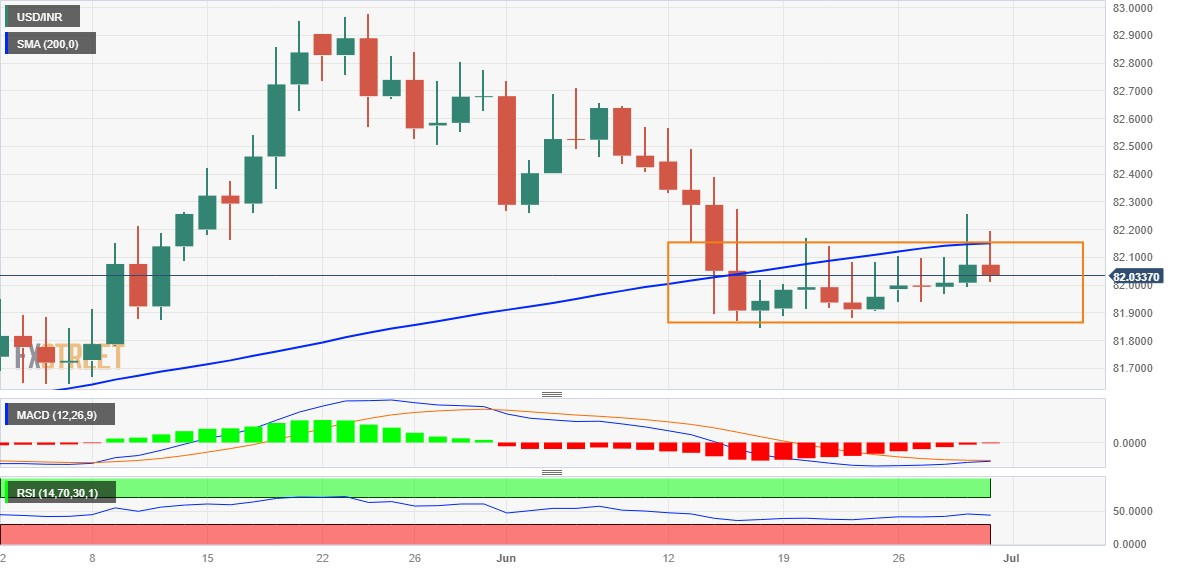
Against the backdrop of the recent pullback from the vicinity of the 83.00 mark, the recent range-bound price action might still be categorized as a bearish consolidation phase. Moreover, the overnight failure to find acceptance above a technically significant 200-day Simple Moving Average (SMA) and the subsequent slide suggests that the path of least resistance for the USD/INR pair is to the downside.

Furthermore, technical indicators on the daily chart - though have been recovering from lower levels - are still holding in the bearish territory. That said, it will still be prudent to wait for a sustained break below the trading range support, around the 81.85 area, before placing fresh bearish bets around the USD/INR pair and positioning for a slide to the 81.50 en route to sub-81.00 levels or the monthly swing low.

On the flip side, some follow-through buying beyond the overnight swing high, around the 82.25 region, could be seen as a positive breakout through the short-term trading range and pave the way for additional gains. The subsequent move up has the potential to lift the USD/INR pair back towards the 82.70-82.75 intermediate hurdle, above which bulls are likely to make a fresh attempt to conquer the 83.00 mark.

USD/INR daily chart

fxsoriginal

Key levels to watch

USD/INR

Overview
Today last price82.0415
Today Daily Change-0.0319
Today Daily Change %-0.04
Today daily open82.0734
 
Trends
Daily SMA2082.1688
Daily SMA5082.2012
Daily SMA10082.2586
Daily SMA20082.1472
 
Levels
Previous Daily High82.259
Previous Daily Low81.996
Previous Weekly High82.1725
Previous Weekly Low81.8845
Previous Monthly High82.981
Previous Monthly Low81.6435
Daily Fibonacci 38.2%82.1585
Daily Fibonacci 61.8%82.0965
Daily Pivot Point S181.9599
Daily Pivot Point S281.8465
Daily Pivot Point S381.6969
Daily Pivot Point R182.2229
Daily Pivot Point R282.3725
Daily Pivot Point R382.4859

Author

Haresh Menghani

Haresh Menghani is a detail-oriented professional with 10+ years of extensive experience in analysing the global financial markets.

More from Haresh Menghani
Share:

Markets move fast. We move first.

Orange Juice Newsletter brings you expert driven insights - not headlines. Every day on your inbox.

By subscribing you agree to our Terms and conditions.

Editor's Picks

EUR/USD eases toward 1.1700 as USD recovers

EUR/USD stays on the back foot and declines toward 1.1700 on Friday. The pair faces headwinds from a renewed uptick in the US Dollar as investors look past softer US inflation data. However, the EUR/USD downside appears capped by expectations of the Fed-ECB monetary policy divergence. 

GBP/USD steadies below 1.3400 as traders assess BoE policy outlook

Following Thursday's volatile session, GBP/USD moves sideways below 1.3400 on Friday. Investors reassess the Bank of England's policy oıtlook after the MPC decided to cut the interest rate by 25 bps by a slim margin. Meanwhile, the US Dollar benefits from the cautious market stance, limiting the pair's upside.

Gold stays weak below $4,350 as USD bulls shrug off softer US CPI

Gold holds the previous day's late pullback from the vicinity of the record high and stays in the red below $4,350 in the European session on Friday. The US CPI report released on Thursday pointed to cooling inflationary pressures, but the US Dollar seems resilient amid a fresh bout of short-covering.

Bitcoin, Ethereum and Ripple correction slide as BoJ rate decision weighs on sentiment

Bitcoin, Ethereum, and Ripple are extending their correction phases after losing nearly 3%, 8%, and 10%, respectively, through Friday. The pullback phase is further strengthened as the upcoming Bank of Japan’s rate decision on Friday weighs on risk sentiment, with BTC breaking key support, ETH deepening weekly losses, and XRP sliding to multi-month lows.

How much can one month of soft inflation change the Fed’s mind?

One month of softer inflation data is rarely enough to shift Federal Reserve policy on its own, but in a market highly sensitive to every data point, even a single reading can reshape expectations. November’s inflation report offered a welcome sign of cooling price pressures. 

Ethereum Price Forecast: EF outlines ways to solve growing state issues

Ethereum price today: $2,920. The EF noted that Ethereum's growing state could lead to centralization and weaken censorship resistance. The Stateless Consensus team outlined state expiry, state archive and partial statelessness as potential solutions to the growing state load.