|

USD/INR New York Price Forecast: Greenback looking for directions vs. rupee

  • USD/INR remains trapped in a tight range as the week comes to an end.
  • The level to beat for bears is the 71.20 support. 


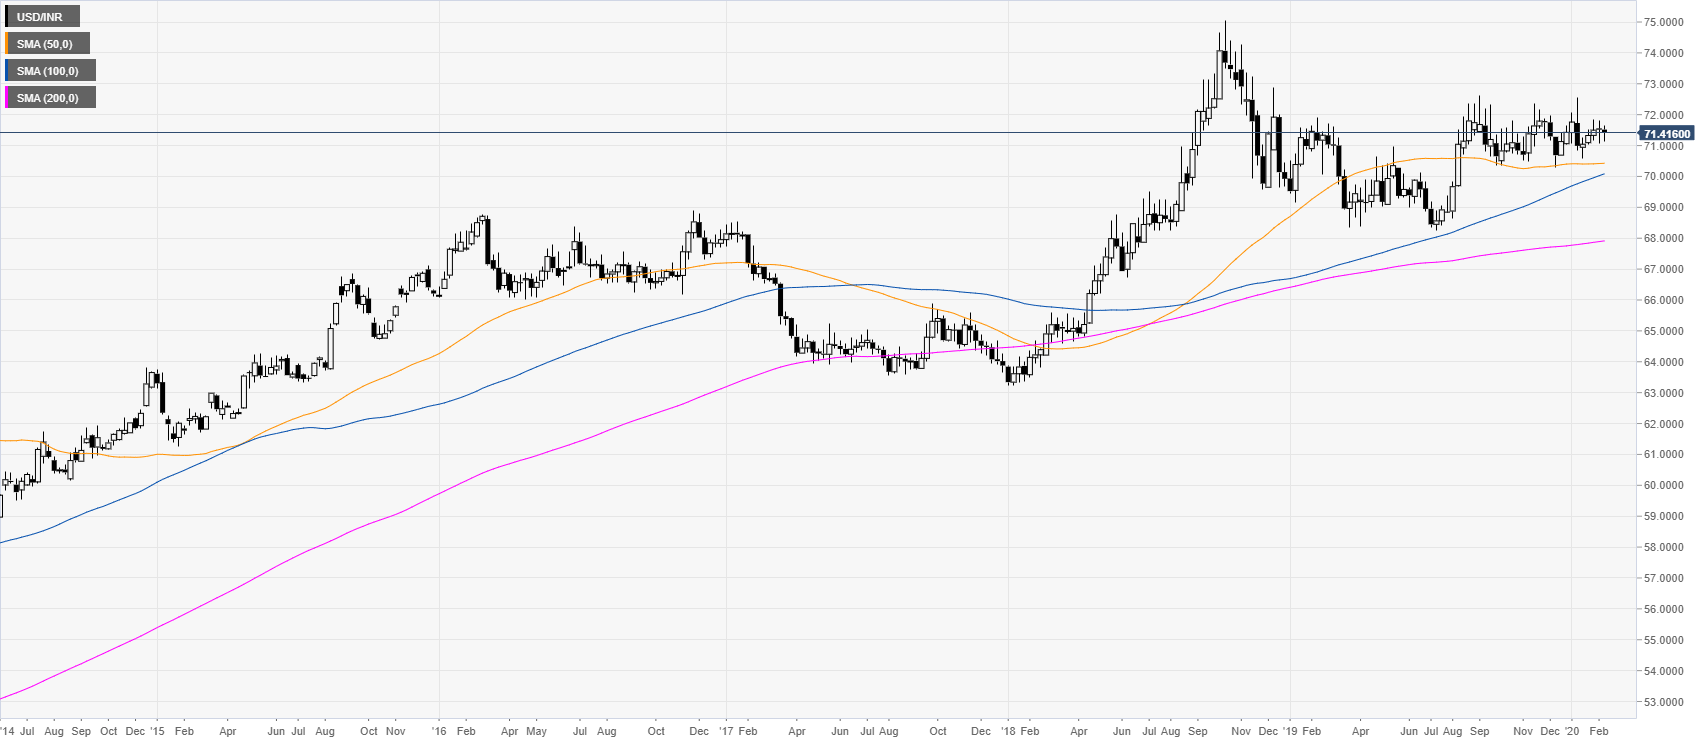
USD/INR weekly chart

 
Following the 2018 bull-run, USD/INR has been consolidating in a rectangle pattern. The spot is trading above the main weekly simple moving averages (SMAs), suggesting a bullish bias in the long term.  
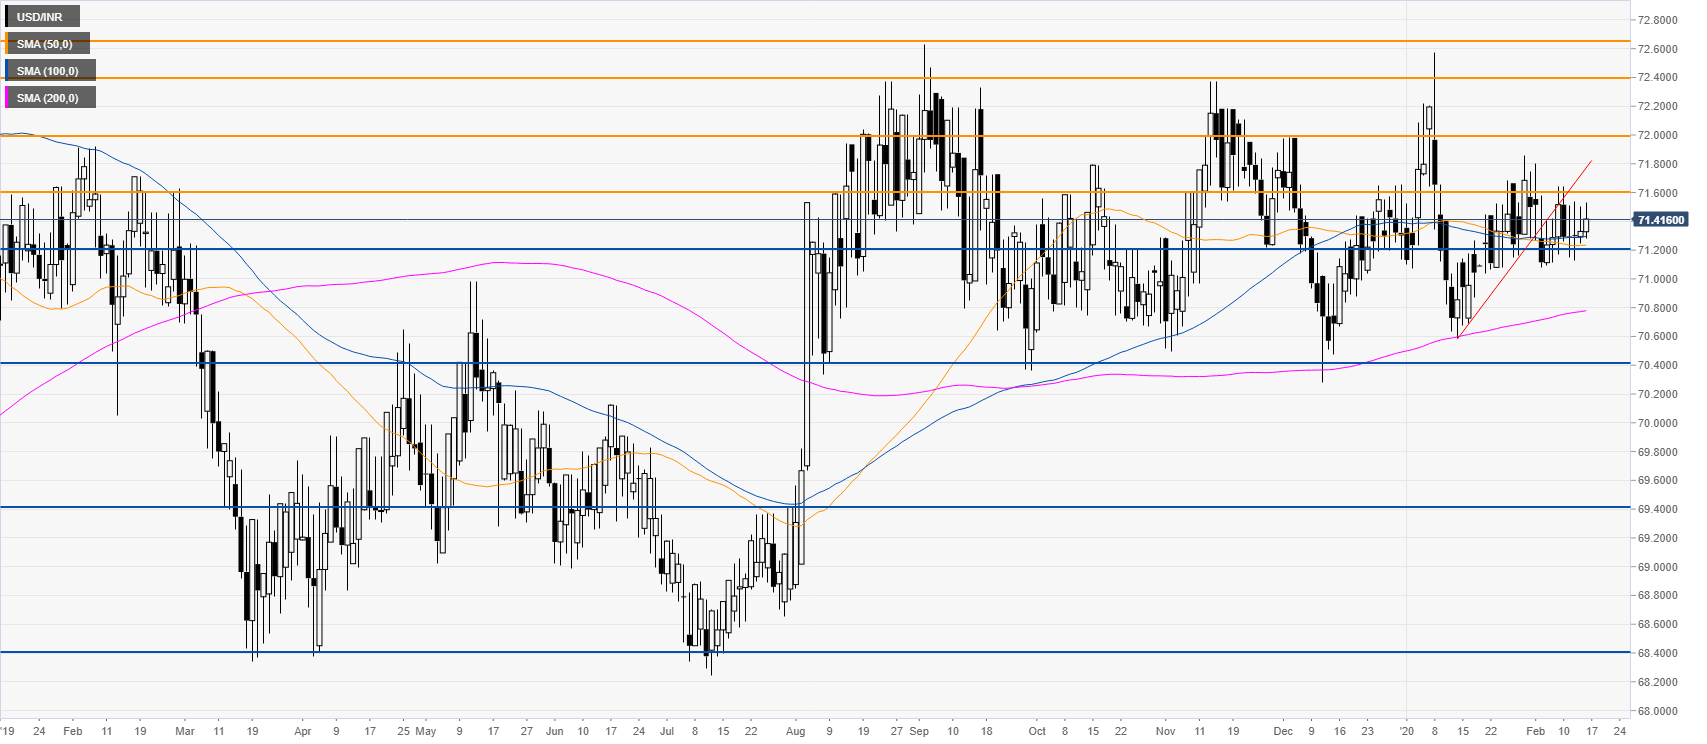
 

USD/INR daily chart


The quote broke below a bear flag formation and challenged the 71.20 support level to then retest the 71.60 resistance. However, USD/INR has entered a tight range while remaining vulnerable below the 71.60/72.00 resistance zone. However, a close above the 72.00 figure on a daily basis would likely invalidate the bearish scenario and yields further upside towards the 72.40 level. 
   

Additional key levels

USD/INR

Overview
Today last price71.4128
Today Daily Change0.0828
Today Daily Change %0.12
Today daily open71.33
 
Trends
Daily SMA2071.2892
Daily SMA5071.1986
Daily SMA10071.2279
Daily SMA20070.6742
 
Levels
Previous Daily High71.505
Previous Daily Low71.2455
Previous Weekly High71.8045
Previous Weekly Low71.077
Previous Monthly High72.57
Previous Monthly Low70.5875
Daily Fibonacci 38.2%71.4059
Daily Fibonacci 61.8%71.3446
Daily Pivot Point S171.2154
Daily Pivot Point S271.1007
Daily Pivot Point S370.9559
Daily Pivot Point R171.4749
Daily Pivot Point R271.6197
Daily Pivot Point R371.7344

Author

Flavio Tosti

Flavio Tosti

Independent Analyst


More from Flavio Tosti
Share:

Editor's Picks

EUR/USD retreats below 1.1800 following earlier rebound

EUR/USD loses its recovery momentum and trades little-changed on the day below 1.1300 in the second half of the day on Wednesday. The modest improvement seen in risk mood limits the US Dollar's gains and allows the pair to hold its ground.

GBP/USD clings to small gains above 1.3500

GBP/USD is posting moderate gains above 1.3500 on Wednesday. The pair edges higher as the US Dollar meets fresh supply amid a modest improvement seen in risk sentiment following US President Donald Trump’s first State of the Union address.

Gold rises toward $5,200, supported by geopolitics and trade jitters

Gold buyers are back in the game, eyeing $5,200 and beyonf on Wednesday after seeing a correction from monthly highs on Tuesday. The US Dollar slips after Trump’s SOTU fails to impress and as AI-driven worries ease. Dovish Fed bets also weigh.  Gold looks north so long as the key 61.8% Fibo resistance at $5,142 holds on the daily chart.

Bitcoin, Ethereum and Ripple post cautious recovery amid downside risks

Bitcoin, Ethereum, and Ripple are posting a cautious recovery on Wednesday following a market correction earlier this week.  BTC is approaching a key breakdown level, while ETH and XRP are rebounding from crucial support levels.

Nvidia remains at the heart of the AI boom

Nvidia remains at the heart of the AI boom, with Q4 revenue projected near $65.6–66.1 billion, nearly 70% higher year-over-year. But investors are watching cash flow, leverage, and broader AI adoption. Growth is strong, but the AI stress isn’t over.

Cosmos Hub Price Forecast: ATOM rebounds slightly, bearish outlook remains intact

Cosmos Hub (ATOM) price rebounds, trading above $2.05 at the time of writing on Wednesday, after undergoing a sharp correction since last week. Weakening on-chain and derivatives data support a bearish outlook, while technical analysis remains unfavorable.