USD/INR trades with bullish bias, investors await US Retail Sales data
- The Indian Rupee loses momentum in Tuesday’s European session amid a stronger Greenback.
- India’s foreign fund inflows, rising Fed rate cut bets, and lower crude oil prices might cap the INR’s downside.
- Investors await the US June Retail Sales and Fed’s Kugler speech on Tuesday.

The Indian Rupee (INR) extends downside on Tuesday as the US Dollar (USD) strengthened across the board. The weakness in the Chinese Yuan after slower-than-expected economic growth in China for the second quarter might weigh on Asian currencies, including the INR.
Nonetheless, the significant India’s foreign fund inflows and the rising odds of the US Federal Reserve (Fed) rate cuts in September could limit the loss in the local currency. Also, the fall in crude oil prices underpin the INR as India was the third-largest oil consumer after the United States (US) and China. Later on Tuesday, investors will monitor the US Retail Sales for June and the speech from the Federal Reserve’s (Fed) Adriana Kugler.
Daily Digest Market Movers: Indian Rupee remains sensitive to global factors and risk sentiment
- India’s Wholesale Price Index (WPI) Inflation rose to a 16-month high of 3.36% YoY in June from 2.61% in May, according to the latest official data released on Monday. This figure was weaker than the 3.50% expected.
- "Positive rate of inflation in June, 2024 is primarily due to increase in prices of food articles, manufacture of food products, crude petroleum & natural gas, mineral oils, other manufacturing etc," said the official press release.
- Indian WPI Food came in at 10.87% YoY in June, compared to 9.82% in May. Meanwhile, the WPI Fuel arrived at 1.03% versus 1.35% earlier.
- Fed Chair Jerome Powell said on Monday that the US has performed remarkably well in recent years, adding that the central bank won't be waiting until inflation reaches the 2% annual target.
- Federal Reserve Bank of San Francisco President Mary Daly did not provide time-based rate cut guidance but acknowledged significant progress on inflation.
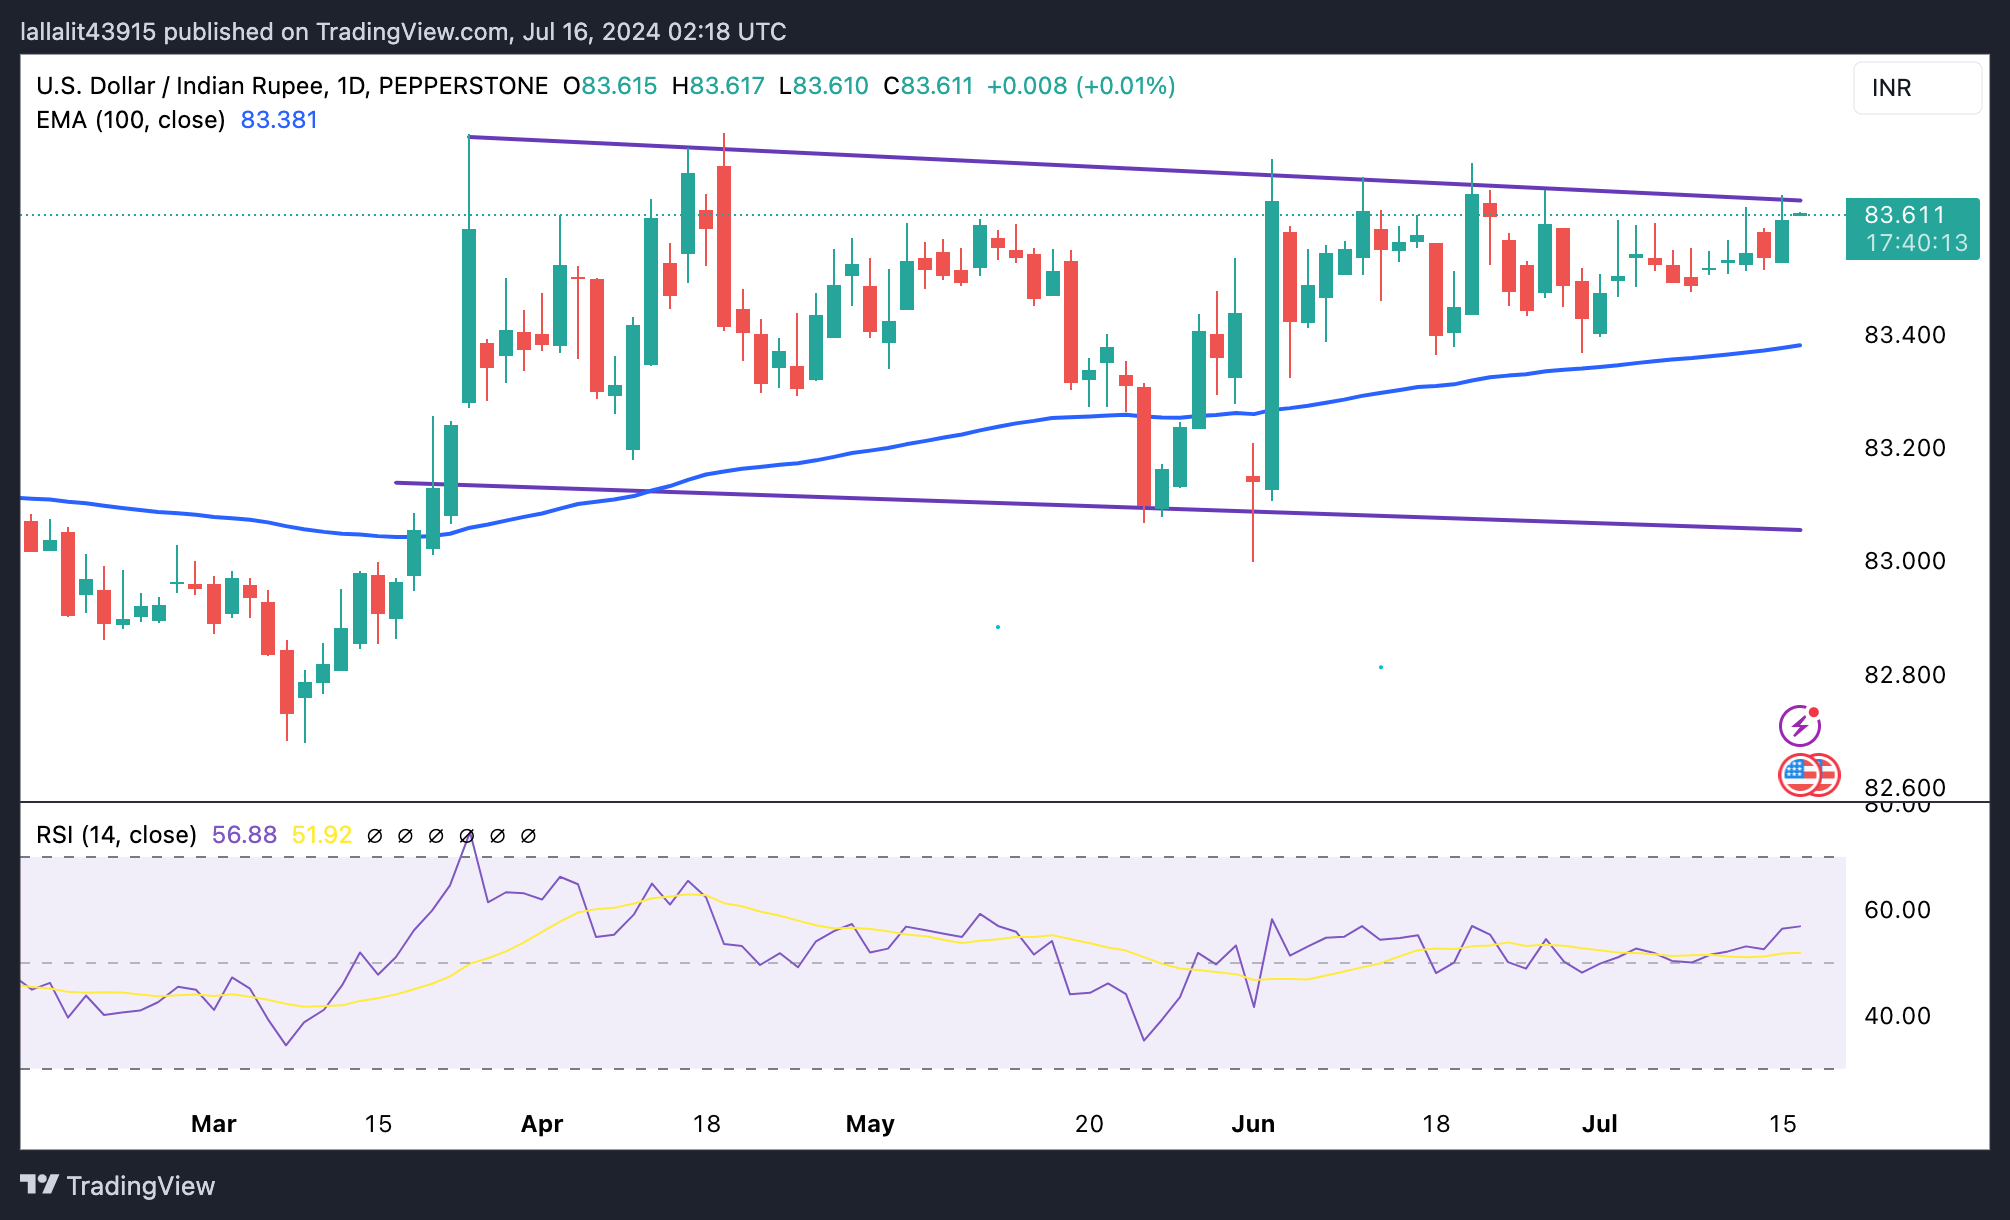
Technical analysis: USD/INR sticks to the consolidation scheme in the short-term
In the near term, the pair has traded within its month-long trading range since March 21.
A move past the resistance area at the upper boundary of the trading range at 83.65 could clear the way for a move back to the all-time high of 83.75. The next upside barrier will emerge at the 84.00 psychological level.
On the other hand, the initial target could be the support level around the 100-day EMA at 83.37. If bearish momentum continues, look for further downside toward the 83.00 round figure, followed by 82.82, a low of January 12.
Inflation FAQs
Inflation measures the rise in the price of a representative basket of goods and services. Headline inflation is usually expressed as a percentage change on a month-on-month (MoM) and year-on-year (YoY) basis. Core inflation excludes more volatile elements such as food and fuel which can fluctuate because of geopolitical and seasonal factors. Core inflation is the figure economists focus on and is the level targeted by central banks, which are mandated to keep inflation at a manageable level, usually around 2%.
The Consumer Price Index (CPI) measures the change in prices of a basket of goods and services over a period of time. It is usually expressed as a percentage change on a month-on-month (MoM) and year-on-year (YoY) basis. Core CPI is the figure targeted by central banks as it excludes volatile food and fuel inputs. When Core CPI rises above 2% it usually results in higher interest rates and vice versa when it falls below 2%. Since higher interest rates are positive for a currency, higher inflation usually results in a stronger currency. The opposite is true when inflation falls.
Although it may seem counter-intuitive, high inflation in a country pushes up the value of its currency and vice versa for lower inflation. This is because the central bank will normally raise interest rates to combat the higher inflation, which attract more global capital inflows from investors looking for a lucrative place to park their money.
Formerly, Gold was the asset investors turned to in times of high inflation because it preserved its value, and whilst investors will often still buy Gold for its safe-haven properties in times of extreme market turmoil, this is not the case most of the time. This is because when inflation is high, central banks will put up interest rates to combat it. Higher interest rates are negative for Gold because they increase the opportunity-cost of holding Gold vis-a-vis an interest-bearing asset or placing the money in a cash deposit account. On the flipside, lower inflation tends to be positive for Gold as it brings interest rates down, making the bright metal a more viable investment alternative.
Author

Lallalit Srijandorn
FXStreet
Lallalit Srijandorn is a Parisian at heart. She has lived in France since 2019 and now becomes a digital entrepreneur based in Paris and Bangkok.


