GBP/USD Price Forecast: Reflects sideways trend amid US-Iran deadlock
- GBP/USD edges up to near 1.3430 as the US Dollar ticks lower.
- The Cable is broadly sideways amid the US-Iran deadlock.
- US President Trump confirmed that Iran’s Ayatollah is involved in negotiations with Washington.

The GBP/USD pair ticks up to near 1.3430 during the early European trade on Thursday, but has been broadly sideways in a range between 1.3407 and 1.3485 over the last four trading days. The Cable struggles for direction as negotiations between the United States (US) and Iran regarding the permanent peace deal fail to make a breakthrough.
Earlier this week, Iran's Tasnim News agency reported on Monday that members of the negotiating team of Tehran have stopped message exchanges with the US through mediators in protest against attacks on Lebanon.
However, US President Donald Trump confirmed on Wednesday that negotiations have not halted and even Iran's Ayatollah [referring to Supreme Leader Mojtaba Khamenei] is involved in negotiations with Washington.
The ongoing closure of the Strait of Hormuz is broadly hurting currencies from economies that rely heavily on oil imports to meet their energy needs.
Meanwhile, investors await the US Nonfarm Payrolls (NFP) data for May, which will be released on Friday. Investors will pay close attention to the US official employment data to get fresh cues regarding the Federal Reserve’s (Fed) monetary policy outlook.
GBP/USD technical analysis
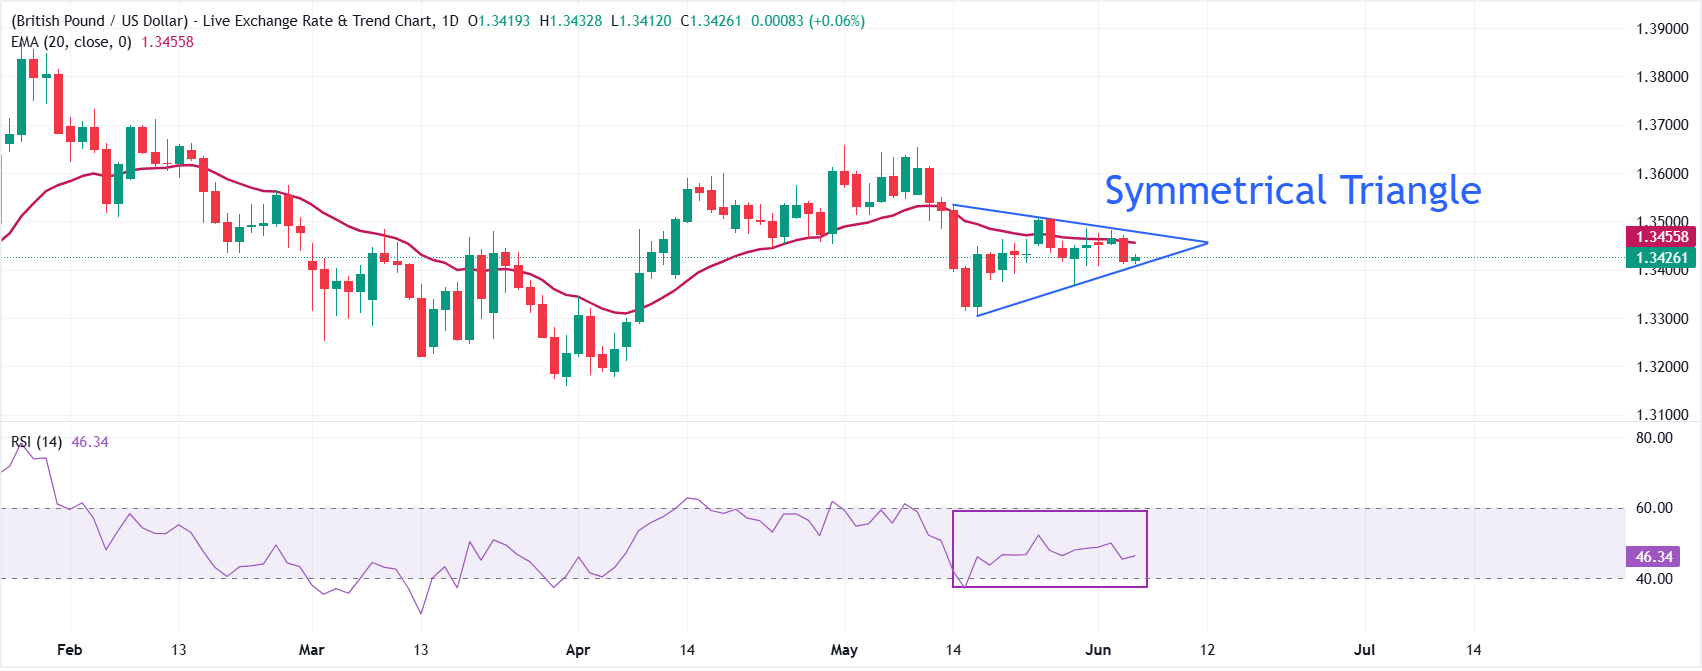
GBP/USD edges higher at around 1.3430 at press time; however, the pair holds a near-term bearish bias as it stays below the 20-period Exponential Moving Average (EMA), which is at 1.3456. The Symmetrical Triangle formation reflects that the overall trend is sideways.
The Relative Strength Index (RSI) oscillates inside the 40.00-60.00 zone, reflecting indecisiveness among investors.
On the topside, initial resistance is seen at the 20-period EMA near 1.3456, with the downward-sloping border of the above-mentioned chart pattern around 1.3478 acting as the next barrier and a level that would need to be reclaimed to ease the current bearish tone. On the downside, the first notable support sits at the Triangle's upward-sloping border near 1.3408; a sustained move below this zone would open the way for further weakness toward the May 18 low at 1.3300.
(The technical analysis of this story was written with the help of an AI tool.)
Economic Indicator
Nonfarm Payrolls
The Nonfarm Payrolls release presents the number of new jobs created in the US during the previous month in all non-agricultural businesses; it is released by the US Bureau of Labor Statistics (BLS). The monthly changes in payrolls can be extremely volatile. The number is also subject to strong reviews, which can also trigger volatility in the Forex board. Generally speaking, a high reading is seen as bullish for the US Dollar (USD), while a low reading is seen as bearish, although previous months' reviews and the Unemployment Rate are as relevant as the headline figure. The market's reaction, therefore, depends on how the market assesses all the data contained in the BLS report as a whole.
Read more.Next release: Fri Jun 05, 2026 12:30
Frequency: Monthly
Consensus: 85K
Previous: 115K
Source: US Bureau of Labor Statistics
America’s monthly jobs report is considered the most important economic indicator for forex traders. Released on the first Friday following the reported month, the change in the number of positions is closely correlated with the overall performance of the economy and is monitored by policymakers. Full employment is one of the Federal Reserve’s mandates and it considers developments in the labor market when setting its policies, thus impacting currencies. Despite several leading indicators shaping estimates, Nonfarm Payrolls tend to surprise markets and trigger substantial volatility. Actual figures beating the consensus tend to be USD bullish.
Author

Sagar Dua
FXStreet
Sagar Dua is associated with the financial markets from his college days. Along with pursuing post-graduation in Commerce in 2014, he started his markets training with chart analysis.


