- The index advances slightly around the 102.50/60 band.
- US yields trade without clear direction so far on Wednesday.
- Weekly Mortgage Applications, Pending Home Sales next on tap.
The greenback, in terms of the USD Index (DXY), regains some composure and revisits the 102.50/60 area on Wednesday.
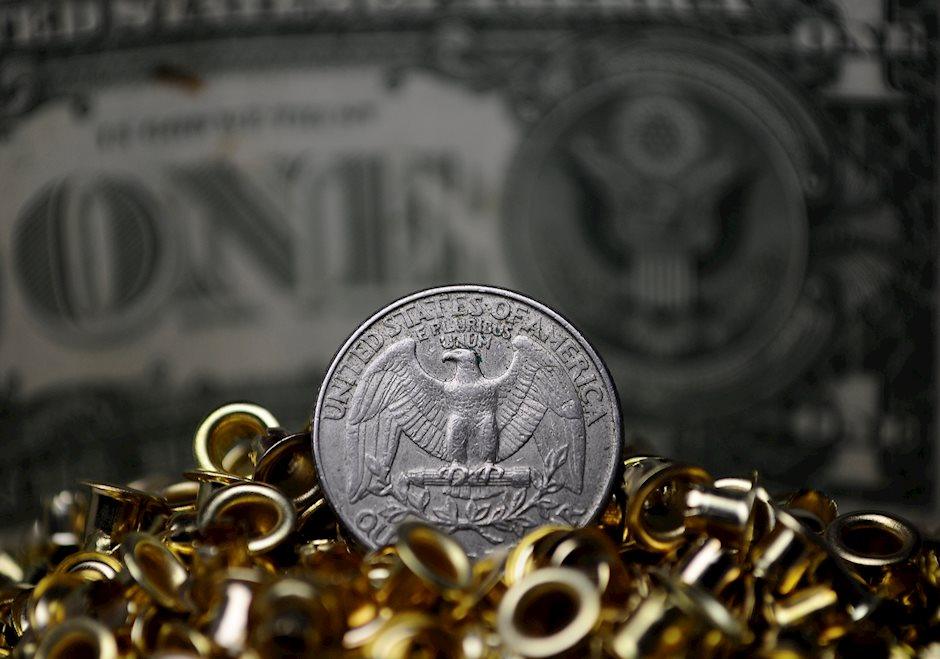
USD Index looks at risk trends, banking sector
The current bullish attempt comes after two consecutive daily declines and on the back of the tepid knee-jerk in the risk complex as well as the lack of direction surrounding US yields.
In the meantime, banking concerns appear far from abated and somewhat underpin the better tone in the dollar via a firmer demand for the safe haven universe.
On the negative side for the buck, the likelihood that the Federal Reserve might pause its tightening stance at the May gathering continues to weigh on the currency, at the time when the probability of this scenario hovers around 60% according to CME Group’s FedWatch Tool.
In the US data space, weekly MBA Mortgage Applications are due seconded by Pending Home Sales and the weekly report on US crude oil inventories by the EIA.
What to look for around USD
The index picks up some pace and retakes the mid-102.00s amidst some correction in the risk complex on Wednesday.
So far, speculation of a potential Fed’s pivot in the short-term horizon should keep weighing on the dollar, although the still elevated inflation, the resilience of the US economy and the hawkish narrative from Fed speakers are all seen playing against that view for the time being.
Key events in the US this week: MBA Mortgage Applications, Pending Home Sales (Wednesday) – Final Q4 GDP Growth Rate, Initial Jobless Claims (Thursday) – PCE, Personal Income/Spending, Final Michigan Consumer Sentiment (Friday).
Eminent issues on the back boiler: Persistent debate over a soft/hard landing of the US economy. Terminal Interest rate near the peak vs. speculation of rate cuts in 2024. Fed’s pivot. Geopolitical effervescence vs. Russia and China. US-China trade conflict.
USD Index relevant levels
Now, the index is advancing 0.17% at 102.59 and faces the next resistance level at 103.36 (55-day SMA) followed by 104.15 (100-day SMA) and then 105.88 (2023 high March 8). On the other hand, the breach of 101.93 (monthly low March 23) would open the door to 100.82 (2023 low February 2) and finally 100.00 (psychological level).
Information on these pages contains forward-looking statements that involve risks and uncertainties. Markets and instruments profiled on this page are for informational purposes only and should not in any way come across as a recommendation to buy or sell in these assets. You should do your own thorough research before making any investment decisions. FXStreet does not in any way guarantee that this information is free from mistakes, errors, or material misstatements. It also does not guarantee that this information is of a timely nature. Investing in Open Markets involves a great deal of risk, including the loss of all or a portion of your investment, as well as emotional distress. All risks, losses and costs associated with investing, including total loss of principal, are your responsibility. The views and opinions expressed in this article are those of the authors and do not necessarily reflect the official policy or position of FXStreet nor its advertisers. The author will not be held responsible for information that is found at the end of links posted on this page.
If not otherwise explicitly mentioned in the body of the article, at the time of writing, the author has no position in any stock mentioned in this article and no business relationship with any company mentioned. The author has not received compensation for writing this article, other than from FXStreet.
FXStreet and the author do not provide personalized recommendations. The author makes no representations as to the accuracy, completeness, or suitability of this information. FXStreet and the author will not be liable for any errors, omissions or any losses, injuries or damages arising from this information and its display or use. Errors and omissions excepted.
The author and FXStreet are not registered investment advisors and nothing in this article is intended to be investment advice.
Recommended content
Editors’ Picks
EUR/USD closes in on 1.0700 amid broad USD strength

EUR/USD came under renewed bearish pressure in the American session and dropped to its lowest level since late March near 1.0700. Stronger-than-forecast PCE inflation data and hawkish comments from Fed's Mester provide a boost to the US Dollar and weigh on the pair.
GBP/USD loses bullish momentum after US data, falls below 1.2350

GBP/USD has reversed its direction and erased a large portion of its daily gains on Friday after the data from the US showed that the annual core PCE inflation edged higher to 4.7% in April. Although the pair clings to small daily gains below 1.2350, it remains on track to end the third straight week in negative territory.
Gold erases daily gains, holds above $1,940

Gold price turned south and declined to the $1,940 area in the American session on Friday. The benchmark 10-year US Treasury bond yield holds stead above 3.8% after stronger-than-expected core PCE inflation data from the US, not allowing XAU/USD to gain traction.
Ethereum price to outpace Bitcoin price as ETH jumps over key hurdle where BTC fumbles

ETH is working on its recovery after it dipped to a two-week low on Thursday. While Bitcoin price has failed to make a similar move and head back above $26,500, Ethereum is outpacing Bitcoin and has been able to push above $1,800.
Ford Stock: New agreement will give customers access to 12,000 Tesla chargers

Ford (F) stock has advanced about 2.5% early Friday following CEO Chris Farley’s announcement that Ford owners will be able to charge their EVs at Tesla Superchargers beginning in early 2024.