|

USD Index Price Analysis: The loss of 102.00 could expose a deeper drop

  • DXY adds to Tuesday’s bearish move and confronts 102.00.
  • Next on the downside emerges the April low near 101.40.

DXY remains under pressure and puts the 102.00 region to the test on Wednesday, adding to the negative price action seen in the previous session.

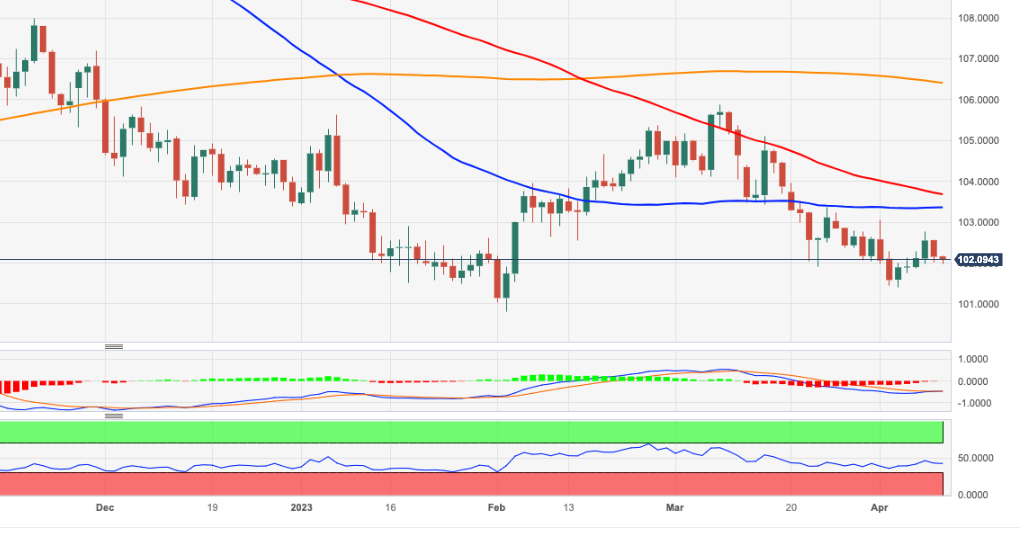
A daily close below the 102.00 mark could open the door to a deeper retracement to, initially, the April low at 101.43 (April 5), while the breach of this level could expose a move to the 2023 low around 100.80 (February 2).

Looking at the broader picture, while below the 200-day SMA, today at 106.42, the outlook for the index is expected to remain negative.

DXY daily chart

Dollar Index Spot

Overview
Today last price102.1
Today Daily Change17
Today Daily Change %-0.06
Today daily open102.16
 
Trends
Daily SMA20102.74
Daily SMA50103.5
Daily SMA100103.67
Daily SMA200106.45
 
Levels
Previous Daily High102.57
Previous Daily Low102.01
Previous Weekly High103.06
Previous Weekly Low101.41
Previous Monthly High105.89
Previous Monthly Low101.92
Daily Fibonacci 38.2%102.22
Daily Fibonacci 61.8%102.35
Daily Pivot Point S1101.92
Daily Pivot Point S2101.69
Daily Pivot Point S3101.37
Daily Pivot Point R1102.48
Daily Pivot Point R2102.8
Daily Pivot Point R3103.03

Author

Pablo Piovano

Born and bred in Argentina, Pablo has been carrying on with his passion for FX markets and trading since his first college years.

More from Pablo Piovano
Share:

Markets move fast. We move first.

Orange Juice Newsletter brings you expert driven insights - not headlines. Every day on your inbox.

By subscribing you agree to our Terms and conditions.

Editor's Picks

EUR/USD softens below 1.1750 amid ECB rate hold expectations

The EUR/USD pair declines to around 1.1730 during the early European session on Wednesday, pressured by renewed US Dollar demand. Nonetheless, the potential downside for the major pair might be limited amid the growing acceptance that the European Central Bank is done cutting interest rates. 

When is the UK CPI inflation data and how could it affect GBP/USD?

The United Kingdom Office for National Statistics will publish the highly relevant Consumer Price Index (CPI) data for November on Wednesday at 07:00 GMT. GBP/USD is likely to stay subdued if UK CPI meets expectations. However, any upside surprise could cap losses by tempering dovish sentiment ahead of the Bank of England’s policy decision on Thursday. 

Gold: Bulls await breakout through multi-day-old range amid Fed rate cut bets

Gold attracts fresh buyers during the Asian session on Wednesday, though it remains confined in a multi-day-old trading range amid mixed fundamental cues. The global risk sentiment remains on the defensive amid economic woes and fears of the AI bubble burst. Moreover, dovish US Federal Reserve expectations lend support to the non-yielding yellow metal, though a modest US Dollar uptick might cap any further appreciating move.

Bitcoin, Ethereum and Ripple extend correction as bearish momentum builds

Bitcoin, Ethereum, and Ripple remain under pressure as the broader market continues its corrective phase into midweek. The weak price action of these top three cryptocurrencies by market capitalization suggests a deeper correction, as momentum indicators are beginning to tilt bearish.

Ukraine-Russia in the spotlight once again

Since the start of the week, gold’s price has moved lower, but has yet to erase the gains made last week. In today’s report we intend to focus on the newest round of peace talks between Russia and Ukraine, whilst noting the release of the US Employment data later on day and end our report with an update in regards to the tensions brewing in Venezuela.

AAVE slips below $186 as bearish signals outweigh the SEC investigation closure

Aave (AAVE) price continues its decline, trading below $186 at the time of writing on Wednesday after a rejection at the key resistance zone. Derivatives positioning and momentum indicators suggest that bearish forces still dominate in the near term.