- DXY trims part of the recent two-day advance.
- Bulls remain focused on the May high in the 104.70 zone.
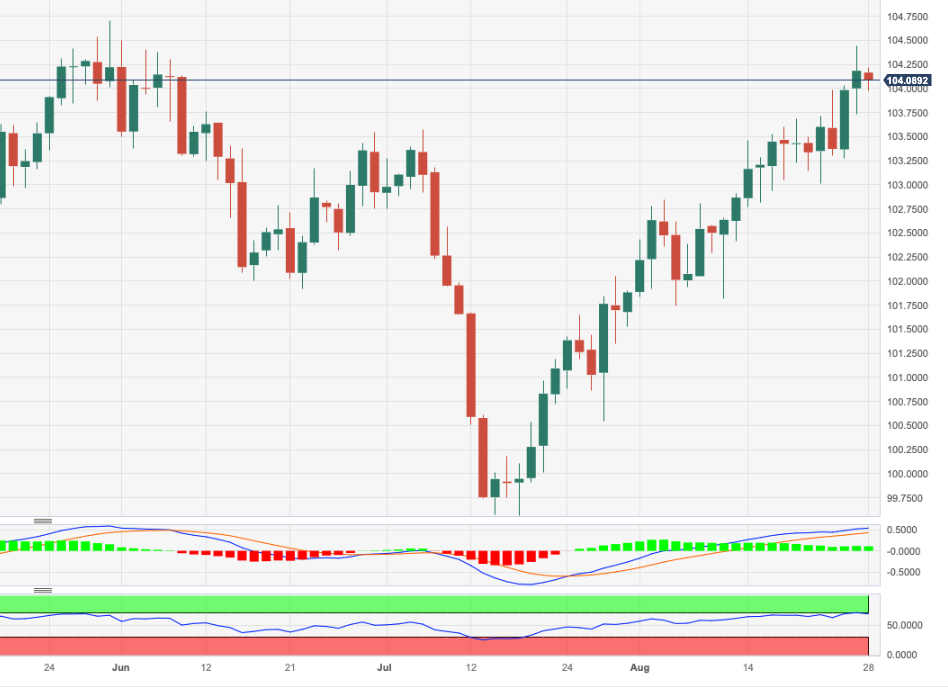
DXY comes under pressure and confronts the key support at the 104.00 region at the beginning of the week.
Immediately to the upside turns up the August top at 104.44 (August 25), while the surpass of this level should open the door to a rapid test of the May high of 104.69 (May 31) prior to the 2023 peak of 105.88 (March 8).
While above the key 200-day SMA, today at 103.10, the outlook for the index is expected to shift to a more constructive one.
DXY daily chart
Information on these pages contains forward-looking statements that involve risks and uncertainties. Markets and instruments profiled on this page are for informational purposes only and should not in any way come across as a recommendation to buy or sell in these assets. You should do your own thorough research before making any investment decisions. FXStreet does not in any way guarantee that this information is free from mistakes, errors, or material misstatements. It also does not guarantee that this information is of a timely nature. Investing in Open Markets involves a great deal of risk, including the loss of all or a portion of your investment, as well as emotional distress. All risks, losses and costs associated with investing, including total loss of principal, are your responsibility. The views and opinions expressed in this article are those of the authors and do not necessarily reflect the official policy or position of FXStreet nor its advertisers. The author will not be held responsible for information that is found at the end of links posted on this page.
If not otherwise explicitly mentioned in the body of the article, at the time of writing, the author has no position in any stock mentioned in this article and no business relationship with any company mentioned. The author has not received compensation for writing this article, other than from FXStreet.
FXStreet and the author do not provide personalized recommendations. The author makes no representations as to the accuracy, completeness, or suitability of this information. FXStreet and the author will not be liable for any errors, omissions or any losses, injuries or damages arising from this information and its display or use. Errors and omissions excepted.
The author and FXStreet are not registered investment advisors and nothing in this article is intended to be investment advice.
Recommended content
Editors’ Picks
EUR/USD eases to daily lows near 1.0260
Better-than-expected results from the US docket on Friday lend wings to the US Dollar and spark a corrective decline in EUR/USD to the area of daily lows near 1.0260.
GBP/USD remains under pressure on strong Dollar, data
GBP/USD remains on track to close another week of losses on Friday, hovering around the 1.2190 zone against the backdrop of the bullish bias in the Greenback and poor results from the UK calendar.
Gold recedes from tops, retests $2,700
The daily improvement in the Greenback motivates Gold prices to give away part of the weekly strong advance and slip back to the vicinity of the $2,700 region per troy ounce at the end of the week.
Five keys to trading Trump 2.0 with Gold, Stocks and the US Dollar Premium
Donald Trump returns to the White House, which impacts the trading environment. An immediate impact on market reaction functions, tariff talk and regulation will be seen. Tax cuts and the fate of the Federal Reserve will be in the background.
Hedara bulls aim for all-time highs
Hedara’s price extends its gains, trading at $0.384 on Friday after rallying more than 38% this week. Hedara announces partnership with Vaultik and World Gemological Institute to tokenize $3 billion in diamonds and gemstones
Trusted Broker Reviews for Smarter Trading
VERIFIED Discover in-depth reviews of reliable brokers. Compare features like spreads, leverage, and platforms. Find the perfect fit for your trading style, from CFDs to Forex pairs like EUR/USD and Gold.