USD/IDR Technical Analysis: MACD turns bullish for the first time in a month
- USD/IDR confronts 50-day SMA after breaking monthly trend line resistance (now support).
- 200-day SMA and a descending trend line since early-August will challenge the Bulls.
USD/IDR trades around 13,964 ahead of the European session on Monday. That said, the pair recently crossed a one-month-old falling trend line and rose to the 50-day SMA.
Buyers will look for sustained trading beyond a 50-day SMA level of 14,022 to escalate the recovery towards 200-day SMA and medium-term resistance line, around 14,140 and 14,210 respectively.
Read: Official: Bank Indonesia intervenes to stabilize markets
In a case where prices manage to remain strong beyond 14,210, multiple tops marked during mid-August around 14,360 will lure buyers.
On the flip side, a daily closing below the resistance-turned-support, around 13,970, will keep dragging the quote to the last-week’s low near 13,840.
USD/IDR daily chart
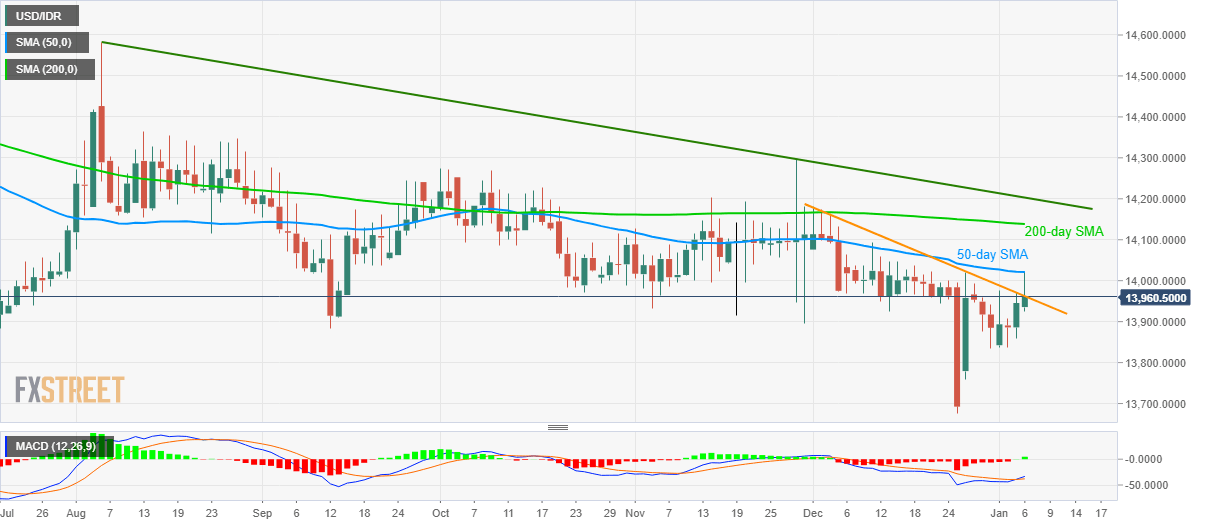
Trend: Bearish
Author

Anil Panchal
FXStreet
Anil Panchal has nearly 15 years of experience in tracking financial markets. With a keen interest in macroeconomics, Anil aptly tracks global news/updates and stays well-informed about the global financial moves and their implications.


