USD/CNH technical analysis: Buyers keep lurking around 21-day EMA
- USD/CNH remains firm above 23.6% Fibonacci retracement, 21-day EMA.
- RSI retraces from overbought conditions.

Following its U-turn from the 21-day exponential moving average (EMA) on Tuesday, USD/CNH rose past-23.6% Fibonacci retracement of March-August upside. The pair currently trades near 7.0537 by the press time of initial Asian session on Thursday.
Not the only pair’s sustained trading above near-term key supports but retracing conditions of 14-bar relative strength index (RSI) also favors brighter chances of additional upside to 7.1000 ahead of targeting latest high near 7.14.
If the quote remains strong above 7.14, bulls will target 7.2000 mark during further increase.
On the downside, 23.6% Fibonacci retracement level of 7.0292 and 21-day EMA level of 6.9955 can entertain short-term sellers in the case of a pullback.
However, pair’s decline below 6.9955 highlights the importance of 6.9626/06 area comprising 38.2% Fibonacci retracement and June month top.
USD/CNH daily chart
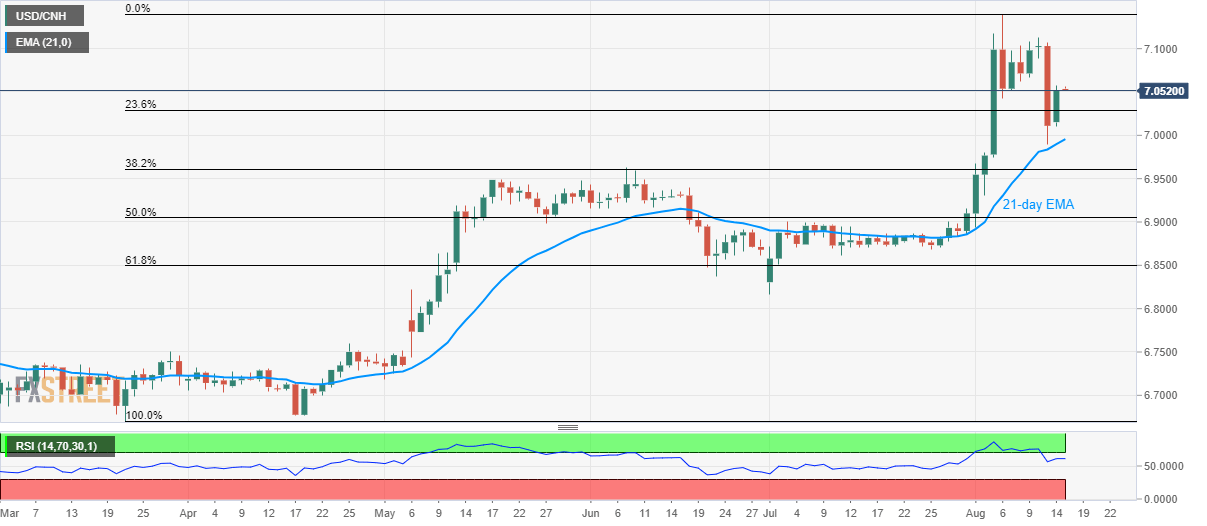
Trend: Bullish
Author

Anil Panchal
FXStreet
Anil Panchal has nearly 15 years of experience in tracking financial markets. With a keen interest in macroeconomics, Anil aptly tracks global news/updates and stays well-informed about the global financial moves and their implications.


