USD/CNH Price Forecast: Seems vulnerable near YTD low, around 7.1600 amid a bearish USD
- USD/CNH resumes its downtrend on the back of the bearish sentiment surrounding the USD.
- The technical setup favors bearish traders and backs the case for a further depreciating move.
- Any attempted recovery could be seen as a selling opportunity and remain capped near 7.1800.

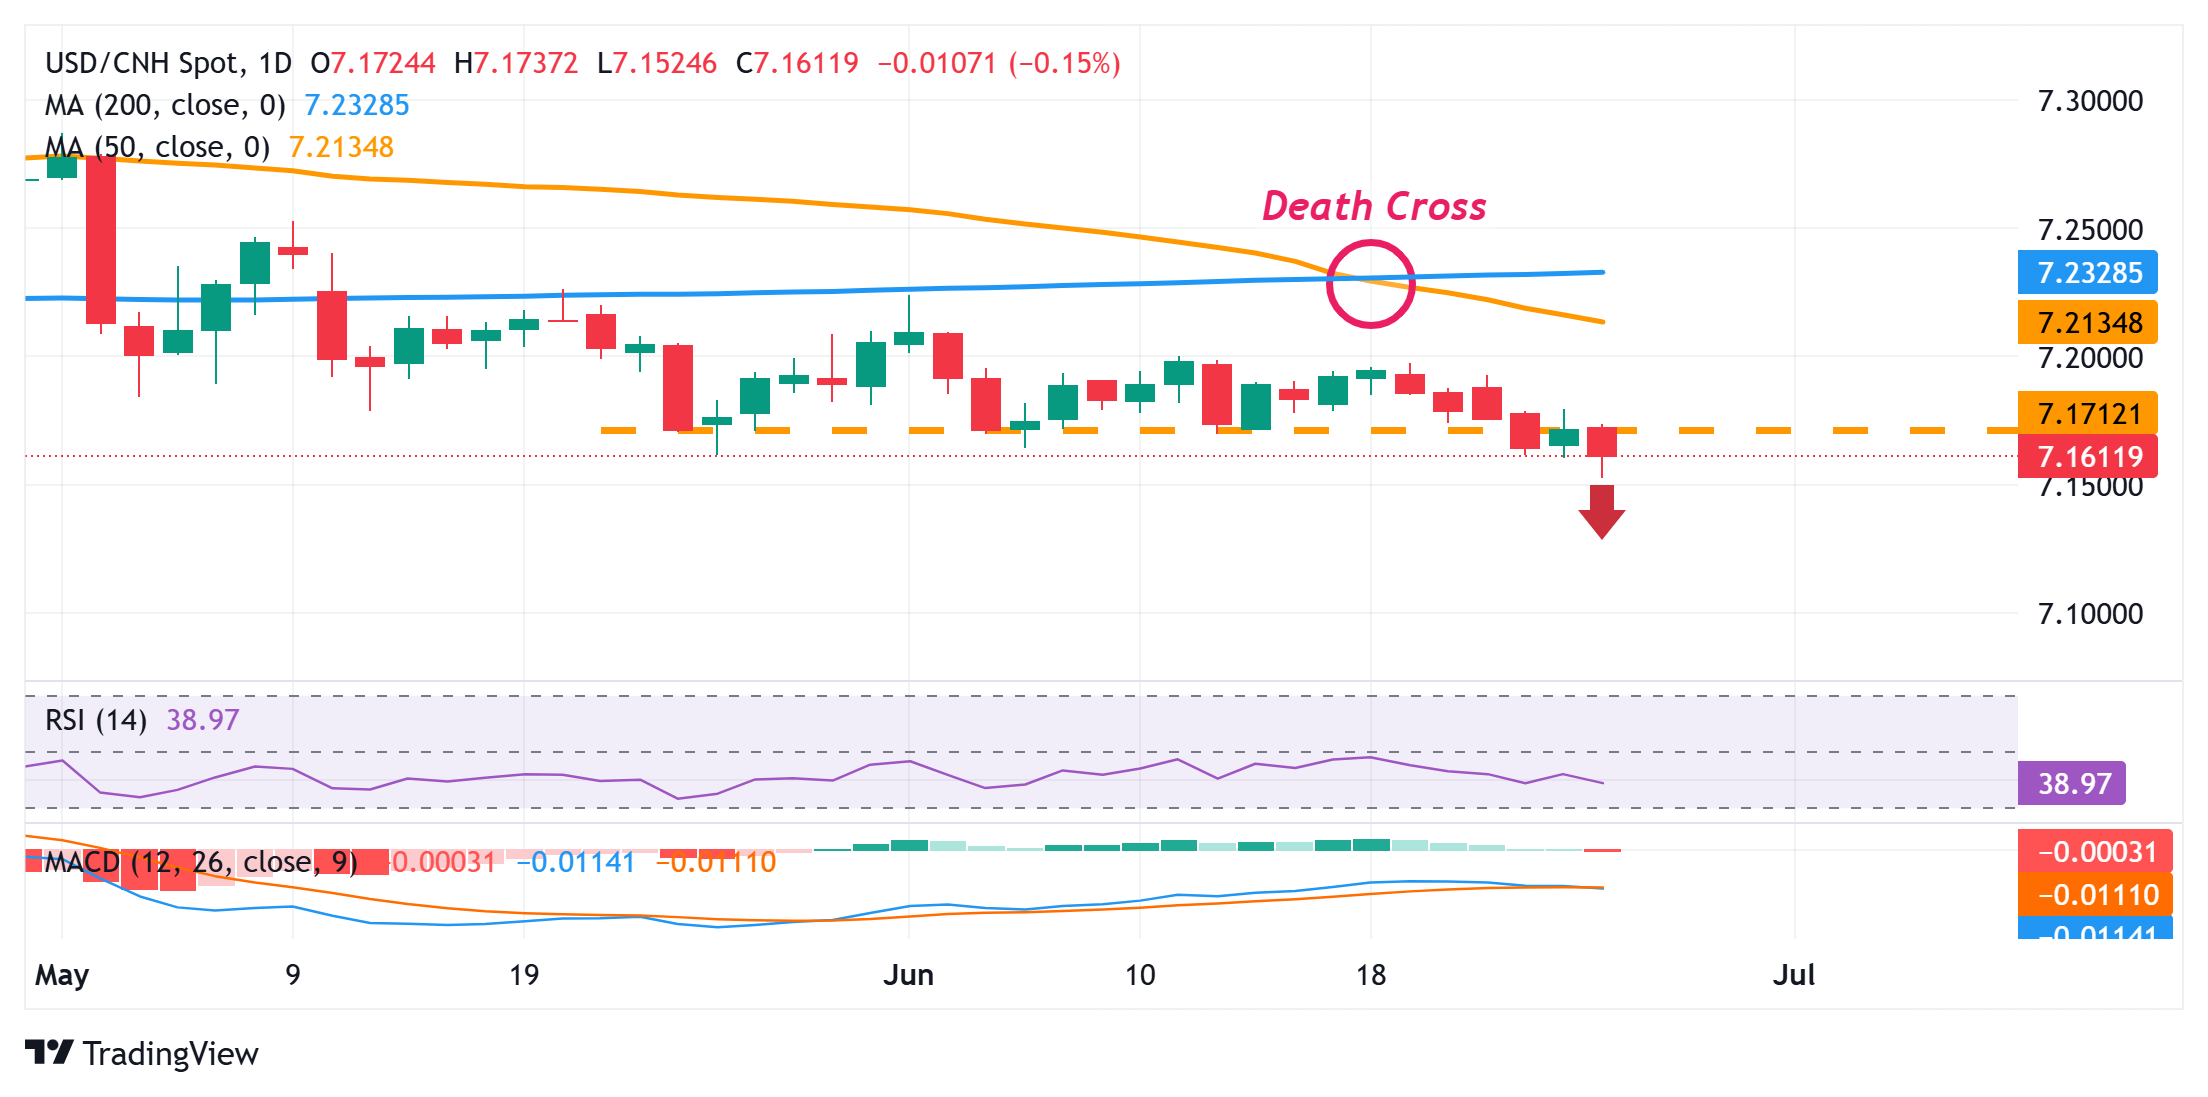
The USD/CNH pair attracts fresh sellers following the previous day's modest uptick and touches a fresh year-to-date low, around the 7.1525 area during the Asian session on Thursday. Moreover, a bearish technical setup backs the case for further near-term depreciation for spot prices.
The recent breakdown below a technically significant 200-day Simple Moving Average (SMA) was seen as a fresh trigger for the USD/CHF bears. Moreover, the occurrence of a death cross on the daily chart (50-day SMA crossing below 200-day SMA) and an intraday breakdown below the 7.1715 horizontal support add credence to the negative outlook.
Furthermore, oscillators on the daily chart are holding deep in negative territory and are still away from being in the oversold zone, suggesting that the path of least resistance for the USD/CNH pair remains to the downside. Hence, a subsequent slide toward testing the next relevant support, around the 7.1450-7.1445 area, looks like a distinct possibility.
On the flip side, recovery attempts might now confront stiff resistance near the 7.1715 horizontal support breakpoint. Any further move up could be seen as a selling opportunity and runs the risk of fizzling out near the overnight swing high, just ahead of the 7.1800 mark. A sustained strength beyond the latter, however, could pave the way for additional gains.
USD/CNH daily chart
US Dollar FAQs
The US Dollar (USD) is the official currency of the United States of America, and the ‘de facto’ currency of a significant number of other countries where it is found in circulation alongside local notes. It is the most heavily traded currency in the world, accounting for over 88% of all global foreign exchange turnover, or an average of $6.6 trillion in transactions per day, according to data from 2022. Following the second world war, the USD took over from the British Pound as the world’s reserve currency. For most of its history, the US Dollar was backed by Gold, until the Bretton Woods Agreement in 1971 when the Gold Standard went away.
The most important single factor impacting on the value of the US Dollar is monetary policy, which is shaped by the Federal Reserve (Fed). The Fed has two mandates: to achieve price stability (control inflation) and foster full employment. Its primary tool to achieve these two goals is by adjusting interest rates. When prices are rising too quickly and inflation is above the Fed’s 2% target, the Fed will raise rates, which helps the USD value. When inflation falls below 2% or the Unemployment Rate is too high, the Fed may lower interest rates, which weighs on the Greenback.
In extreme situations, the Federal Reserve can also print more Dollars and enact quantitative easing (QE). QE is the process by which the Fed substantially increases the flow of credit in a stuck financial system. It is a non-standard policy measure used when credit has dried up because banks will not lend to each other (out of the fear of counterparty default). It is a last resort when simply lowering interest rates is unlikely to achieve the necessary result. It was the Fed’s weapon of choice to combat the credit crunch that occurred during the Great Financial Crisis in 2008. It involves the Fed printing more Dollars and using them to buy US government bonds predominantly from financial institutions. QE usually leads to a weaker US Dollar.
Quantitative tightening (QT) is the reverse process whereby the Federal Reserve stops buying bonds from financial institutions and does not reinvest the principal from the bonds it holds maturing in new purchases. It is usually positive for the US Dollar.
Author

Haresh Menghani
FXStreet
Haresh Menghani is a detail-oriented professional with 10+ years of extensive experience in analysing the global financial markets.


