USD/CNH Price Analysis: Refreshes seven-week top on crossing 6.4700 key hurdle


  • USD/CNH rises for the ninth consecutive day, attacks intraday top.
  • Clear break of 100-day SMA, 50% Fibonacci retracement favor bulls.
  • 61.8% Fibo can test the bulls amid overbought RSI conditions.

USD/CNH picks up bids to 6.4875, up 0.10% intraday, while refreshing the highest levels since early May amid Wednesday’s Asian session.

The Chinese currency (CNH) pair remains on the front foot for the ninth day in a row while justifying the upside break of 100-day SMA and 5% Fibonacci retracement (Fibo.) of April–May declines.

Although sustained crossing of the key hurdle, now support, favor USD/CNH bulls, overbought RSI conditions may trigger the quote’s pullback around 61.8% Fibo. level close to 6.4975.

If at all, the cross-currency pair stays firm beyond 6.4975, the 6.5000 psychological magnet will be crucial to watch for the bulls.

Meanwhile, the pair’s short-term pullback will be tested by the stated support confluence around 6.4700, a break of which will have an additional downside filter in the form of two-month-old horizontal support around 6.4600.

It should, however, be noted that the USD/CNH weakness below 6.4600 will make it vulnerable to recall the early month tops near 6.4100 on the chart.

USD/CNH daily chart

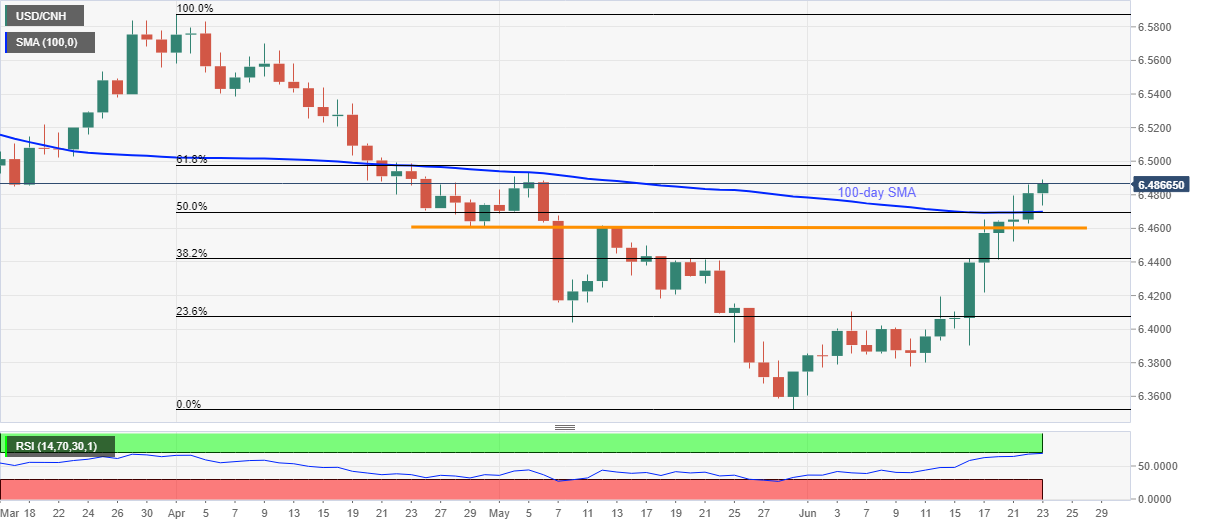
Trend: Pullback expected

additional important levels

Overview
Today last price 6.4873
Today Daily Change 0.0063
Today Daily Change % 0.10%
Today daily open 6.481
 
Trends
Daily SMA20 6.406
Daily SMA50 6.4415
Daily SMA100 6.4697
Daily SMA200 6.5337
 
Levels
Previous Daily High 6.4862
Previous Daily Low 6.463
Previous Weekly High 6.4654
Previous Weekly Low 6.3902
Previous Monthly High 6.493
Previous Monthly Low 6.3524
Daily Fibonacci 38.2% 6.4773
Daily Fibonacci 61.8% 6.4719
Daily Pivot Point S1 6.4673
Daily Pivot Point S2 6.4536
Daily Pivot Point S3 6.4442
Daily Pivot Point R1 6.4904
Daily Pivot Point R2 6.4998
Daily Pivot Point R3 6.5135


Share: Feed news

Information on these pages contains forward-looking statements that involve risks and uncertainties. Markets and instruments profiled on this page are for informational purposes only and should not in any way come across as a recommendation to buy or sell in these assets. You should do your own thorough research before making any investment decisions. FXStreet does not in any way guarantee that this information is free from mistakes, errors, or material misstatements. It also does not guarantee that this information is of a timely nature. Investing in Open Markets involves a great deal of risk, including the loss of all or a portion of your investment, as well as emotional distress. All risks, losses and costs associated with investing, including total loss of principal, are your responsibility. The views and opinions expressed in this article are those of the authors and do not necessarily reflect the official policy or position of FXStreet nor its advertisers. The author will not be held responsible for information that is found at the end of links posted on this page.

If not otherwise explicitly mentioned in the body of the article, at the time of writing, the author has no position in any stock mentioned in this article and no business relationship with any company mentioned. The author has not received compensation for writing this article, other than from FXStreet.

FXStreet and the author do not provide personalized recommendations. The author makes no representations as to the accuracy, completeness, or suitability of this information. FXStreet and the author will not be liable for any errors, omissions or any losses, injuries or damages arising from this information and its display or use. Errors and omissions excepted.

The author and FXStreet are not registered investment advisors and nothing in this article is intended to be investment advice.

Recommended content


Recommended content

Editors’ Picks

AUD/USD hovers around 0.6500 amid light trading, ahead of US GDP

AUD/USD hovers around 0.6500 amid light trading, ahead of US GDP

AUD/USD is trading close to 0.6500 in Asian trading on Thursday, lacking a clear directional impetus amid an Anzac Day holiday in Australia. Meanwhile, traders stay cautious due ti risk-aversion and ahead of the key US Q1 GDP release. 

AUD/USD News

USD/JPY finds its highest bids since 1990, near 155.50

USD/JPY finds its highest bids since 1990, near 155.50

USD/JPY keeps breaking into its highest chart territory since June of 1990 early Thursday, testing 155.50 for the first time in 34 years as the Japanese Yen remains vulnerable, despite looming Japanese intervention risks. Focus shifts to Thursday's US GDP report and the BoJ decision on Friday. 

USD/JPY News

Gold price lacks firm intraday direction, holds steady above $2,300 ahead of US data

Gold price lacks firm intraday direction, holds steady above $2,300 ahead of US data

Gold price remains confined in a narrow band for the second straight day on Thursday. Reduced Fed rate cut bets and a positive risk tone cap the upside for the commodity. Traders now await key US macro data before positioning for the near-term trajectory.

Gold News

Injective price weakness persists despite over 5.9 million INJ tokens burned

Injective price weakness persists despite over 5.9 million INJ tokens burned

Injective price is trading with a bearish bias, stuck in the lower section of the market range. The bearish outlook abounds despite the network's deflationary efforts to pump the price. Coupled with broader market gloom, INJ token’s doomed days may not be over yet.

Read more

Meta Platforms Earnings: META sinks 10% on lower Q2 revenue guidance Premium

Meta Platforms Earnings: META sinks 10% on lower Q2 revenue guidance

This must be "opposites" week. While Doppelganger Tesla rode horrible misses on Tuesday to a double-digit rally, Meta Platforms produced impressive beats above Wall Street consensus after the close on Wednesday, only to watch the share price collapse by nearly 10%.

Read more

Forex MAJORS

Cryptocurrencies

Signatures