|

USD/CNH Price Analysis: Pullback from fortnight-old resistance eyes 100-SMA retest

  • USD/CNH takes offers to renew intraday low, snaps two-day uptrend at weekly top.
  • China’s Industrial Profits rose 3.5% during January-April versus 8.5% prior.
  • Overbought RSI, key hurdles triggered the latest retreat suggesting further weakness towards 100-SMA.
  • Previous resistance from early acts as an extra filter to the south, bulls need to break 6.7900 to retake control.

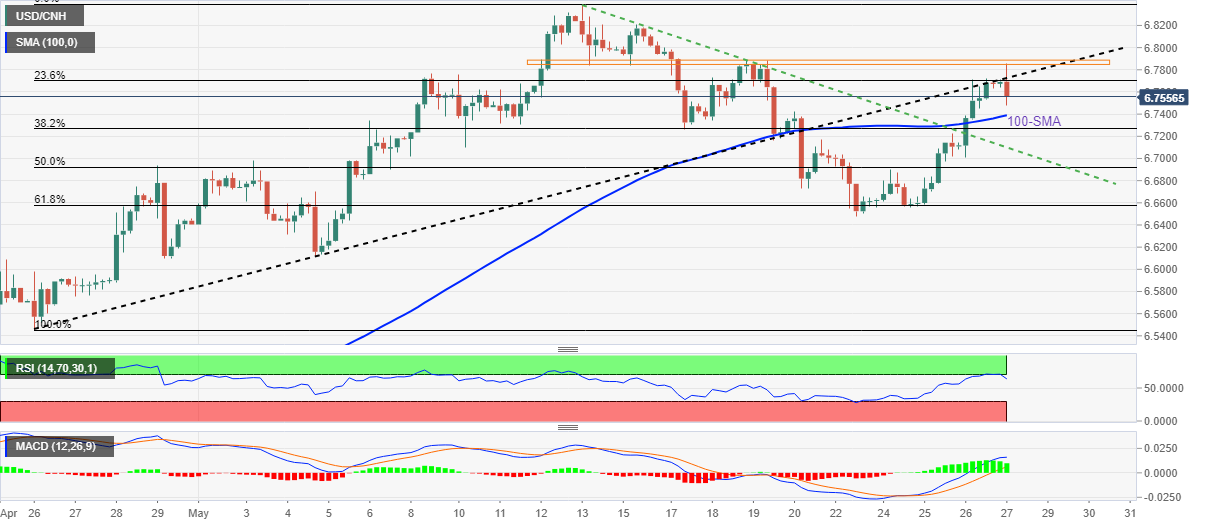
USD/CNH remains on the back foot around the intraday low of 6.7515 as sellers cheer the broad US dollar weakness, by also ignoring the downbeat China data during Friday’s Asian session.

That said, China’s Industrial Profits for the January-April period dropped to 3.5% versus 8.5% prior whereas the figures for April slumped to -8.5% versus 12.2% previous gains.

Technically, multiple levels marked since May 12, near 6.7860-7900, joined overbought RSI conditions to trigger the latest AUD/USD weakness.

Also keeping the sellers hopeful is the pair’s inability to cross the previous support line from late April, around 6.7750 by the press time.

The quote’s latest weakness eyes the 100-SMA level of 6.7390. However, the previous resistance line from early May, close to 6.7100, could test the bears afterward.

Should USD/CNH prices drop below 6.7100, the 61.8% Fibonacci retracement of late April to early May upside, near 6.6575, will be in focus.

USD/CNH: Four-hour chart

Trend: Further weakness expected

Additional important levels

Overview
Today last price6.7664
Today Daily Change-0.0030
Today Daily Change %-0.04%
Today daily open6.7694
 
Trends
Daily SMA206.7219
Daily SMA506.5394
Daily SMA1006.4437
Daily SMA2006.4286
 
Levels
Previous Daily High6.772
Previous Daily Low6.7012
Previous Weekly High6.8206
Previous Weekly Low6.6726
Previous Monthly High6.694
Previous Monthly Low6.3512
Daily Fibonacci 38.2%6.7449
Daily Fibonacci 61.8%6.7283
Daily Pivot Point S16.7231
Daily Pivot Point S26.6768
Daily Pivot Point S36.6524
Daily Pivot Point R16.7938
Daily Pivot Point R26.8182
Daily Pivot Point R36.8645

Author

Anil Panchal

Anil Panchal

FXStreet

Anil Panchal has nearly 15 years of experience in tracking financial markets. With a keen interest in macroeconomics, Anil aptly tracks global news/updates and stays well-informed about the global financial moves and their implications.

More from Anil Panchal
Share:

Editor's Picks

EUR/USD accelerates losses, focus is on 1.1800

EUR/USD’s selling pressure is gathering pace now, opening the door to a potential test of the key 1.1800 region sooner rather than later. The pair’s pullback comes on the back of marked gains in the US Dollar following US data releases and the publication of the FOMC Minutes later in the day.

GBP/USD turns negative near 1.3540

GBP/USD reverses its initial upside momentum and is now adding to previous declines, revisiting at the same time the 1.3540 region on Wednesday. Cable’s downtick comes on the back of decent gains in the Greenback and easing UK inflation figures, which seem to have reinforced the case for a BoE rate cut in March.

Gold battle to regain $5,000 continues

Gold is back on the front foot on Wednesday, shaking off part of the early week softness and challenging two-day highs just above the key $5,000 mark per troy ounce. The move comes ahead of the FOMC Minutes and is unfolding despite an intense rebound in the US Dollar.

Fed Minutes to shed light on January hold decision amid hawkish rate outlook

The Minutes of the Fed’s January 27-28 monetary policy meeting will be published today. Details of discussions on the decision to leave the policy rate unchanged will be scrutinized by investors.

Mixed UK inflation data no gamechanger for the Bank of England

Food inflation plunged in January, but service sector price pressure is proving stickier. We continue to expect Bank of England rate cuts in March and June. The latest UK inflation read is a mixed bag for the Bank of England, but we doubt it drastically changes the odds of a March rate cut.

Sui extends sideways action ahead of Grayscale’s GSUI ETF launch

Sui is extending its downtrend for the second consecutive day, trading at 0.95 at the time of writing on Wednesday. The Layer-1 token is down over 16% in February and approximately 34% from the start of the year, aligning with the overall bearish sentiment across the crypto market.