|

USD/CNH Price Analysis: Move beyond $6.5000 as breaks ascending triangle

  • USD/CNH edges higher on Friday in the Asian time.
  • Pair looks for additional gains if price decisively crosses $6.5100.
  • Momentum oscillator trades in the overbought zone with a bullish crossover.

USD/CNH manages to sustain the previous day’s gain on Friday and touches the high of $6.5100.  The pair opened lower but swiftly recovered and touch the intraday high at $6.5104.

At the time of writing, USD/CNH is trading at $6.5063, up 0.11% for the day.

USD/CNH Daily Chart

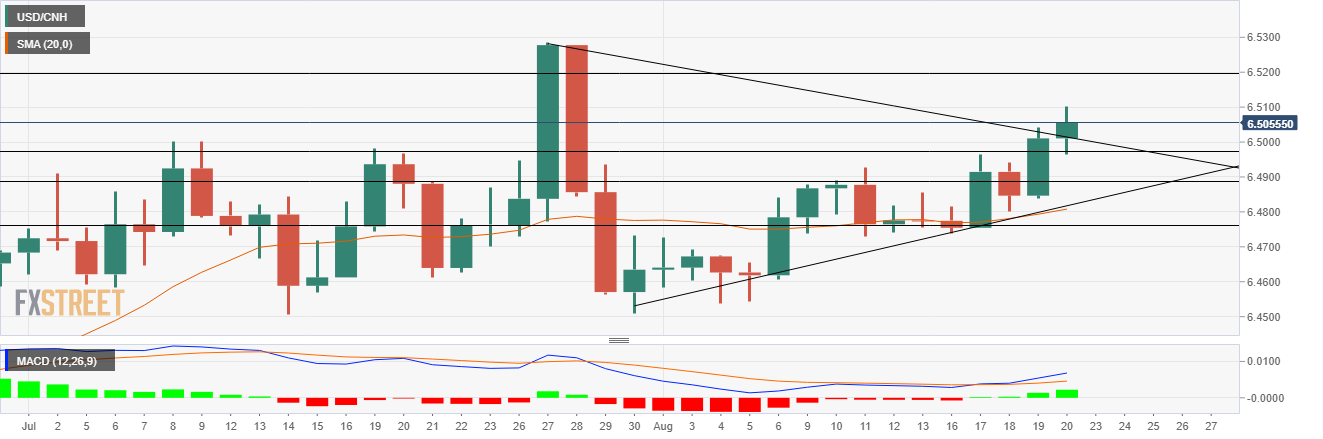
On the daily chart, the pair has been rising since July 30, from the long term support placed at $6.4525.

Price breaks the ascending triangle formation on Friday, which is a bullish price confirmation.

In doing so, USD/CNH bulls would be ready to move forward toward the $6.5200 horizontal resistance level followed by the high of July 28 at $6.5277.

The  Moving Average Convergence Divergence (MACD) indicator signifies the underlying bullish sentiment in the pair. Any uptick in the MACD would amplify the buying opportunity till the high of April 15 at $6.5441.
Alternatively, a reversal in price movement would try to test the $6.4968 horizontal support level.

A daily close below the mentioned level would confirm the dominance of the bears over the price action. 

Next, the market participants keep their eye on the $6.4880 horizontal support level followed by the $6.4776 horizontal support level

USD/CNH additional levels

USD/CNH

Overview
Today last price6.5068
Today Daily Change0.0058
Today Daily Change %0.09
Today daily open6.501
 
Trends
Daily SMA206.4793
Daily SMA506.4702
Daily SMA1006.465
Daily SMA2006.4836
 
Levels
Previous Daily High6.5042
Previous Daily Low6.4838
Previous Weekly High6.4928
Previous Weekly Low6.4728
Previous Monthly High6.5286
Previous Monthly Low6.4508
Daily Fibonacci 38.2%6.4964
Daily Fibonacci 61.8%6.4916
Daily Pivot Point S16.4884
Daily Pivot Point S26.4758
Daily Pivot Point S36.4679
Daily Pivot Point R16.5089
Daily Pivot Point R26.5168
Daily Pivot Point R36.5294

Author

Rekha Chauhan

Rekha Chauhan

Independent Analyst

Rekha Chauhan has been working as a content writer and research analyst in the forex and equity market domain for over two years.

More from Rekha Chauhan
Share:

Editor's Picks

EUR/USD pops to yearly highs near 1.1770

EUR/USD rapidly reverses course and hits fresh YTD tops near 1.1780 at the end of the week. The pair’s U-turn comes on the back of the intense sell-off in the Greenback amid the generalised risk-on context.

GBP/USD climbs to four-month tops near 1.3600

GBP/USD is building on its solid weekly advance and is pushing toward the 1.3600 hurdle on Friday, or new four-month peaks. Cable’s strong move higher comes as the Greenback intensifies its decline, while auspicious results on the UK calendar also collaborate with the uptrend.

Gold picks up pace, approaches $5,000

Gold prices keep their uptrend well in place and gear up for an imminent hit to the key $5,000 mark per troy ounce on Friday. The yellow metal’s sharp advance gathers pace amid the increasing weakness in the US Dollar and mixed US Treasury yields across the curve.

Swiss bank UBS Group mulls Bitcoin and Ethereum offering for select private clients

UBS Group AG plans to offer crypto investment services to select private clients. The offering will allow clients of its private bank in Switzerland to buy and sell Bitcoin and Ethereum.

Week ahead – Fed and BoC meet amid geopolitical upheaval and Trump’s Fed pick

Fed to likely go on pause after three straight cuts. BoC is also expected to stand pat. But will Trump steal the limelight by revealing his Fed chair nomination?

Bitcoin slips below $90,000 as Trump's tariffs swing, ETF outflows pressure price

Bitcoin price struggles below $90,000 on Friday, correcting nearly 5% so far this week. Trump’s Davos speech on Wednesday, backing away from imposing further tariffs on the EU, triggered market volatility and risk-on mood.