|

USD/CHF Technical Analysis: US Dollar bulls en route to the 0.9900 figure
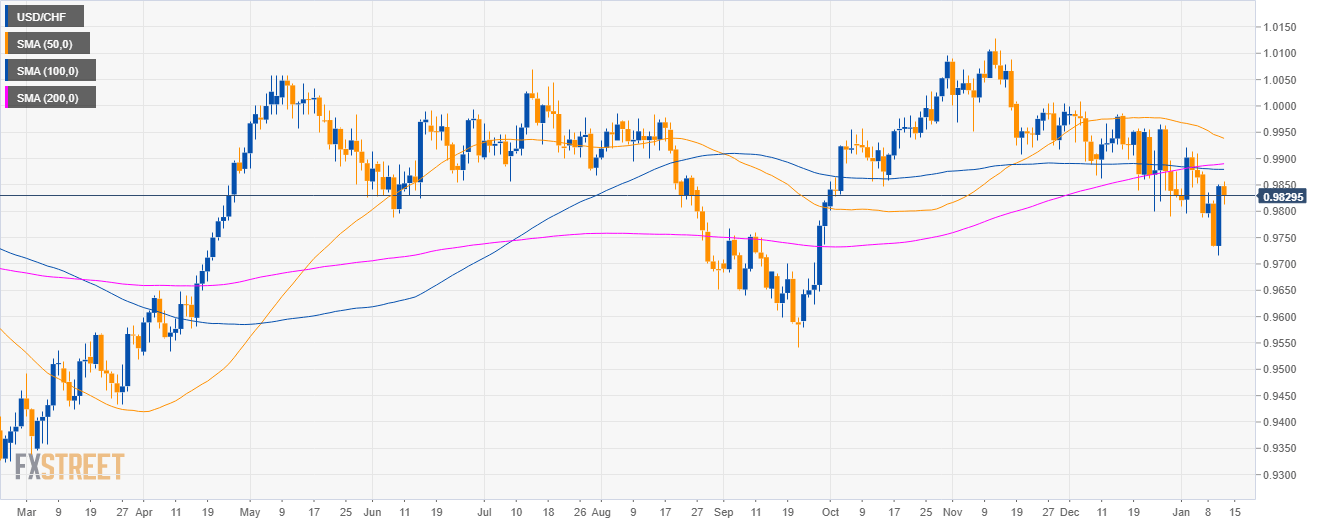
USD/CHF daily chart

  • USD/CHF is trading in a sideways trend below the 50, 100 and 200-period simple moving average (SMA).

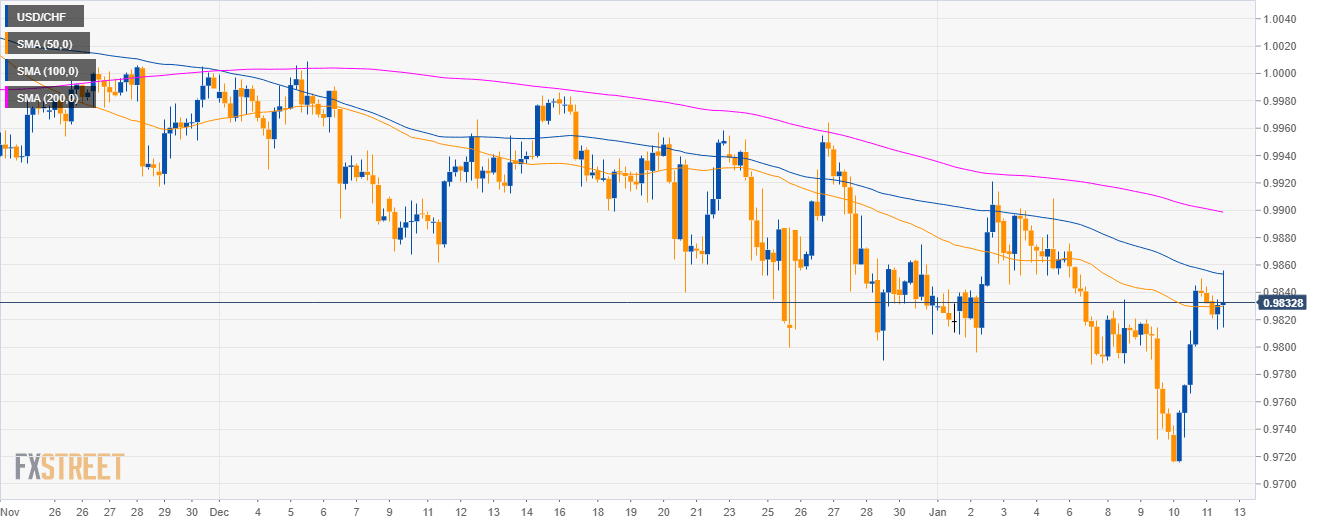
USD/CHF 4-hour chart.

  • Bulls broke above the 0.9800 level and the 50 SMA. 

USD/CHF 30-minute chart

  • Bulls are gaining ground as they reclaimed the 100 and 200 SMAs. They are now en route to the 0.9900 figure. 
  • To the downside 0.9820 and 0.9790 are seen as support. 

Additional key levels

USD/CHF

Overview:
    Today Last Price: 0.9829
    Today Daily change: -19 pips
    Today Daily change %: -0.193%
    Today Daily Open: 0.9848
Trends:
    Previous Daily SMA20: 0.9875
    Previous Daily SMA50: 0.9943
    Previous Daily SMA100: 0.988
    Previous Daily SMA200: 0.9887
Levels:
    Previous Daily High: 0.985
    Previous Daily Low: 0.9716
    Previous Weekly High: 0.9921
    Previous Weekly Low: 0.9796
    Previous Monthly High: 1.0009
    Previous Monthly Low: 0.979
    Previous Daily Fibonacci 38.2%: 0.9799
    Previous Daily Fibonacci 61.8%: 0.9767
    Previous Daily Pivot Point S1: 0.9759
    Previous Daily Pivot Point S2: 0.9671
    Previous Daily Pivot Point S3: 0.9625
    Previous Daily Pivot Point R1: 0.9893
    Previous Daily Pivot Point R2: 0.9939
    Previous Daily Pivot Point R3: 1.0027

Author

Flavio Tosti

Flavio Tosti

Independent Analyst


More from Flavio Tosti
Share:

Editor's Picks

EUR/USD trims losses, flirts with the 1.1850 zone

EUR/USD is back on the back foot on Wednesday, slipping below the 1.1850 area as the US Dollar picks up some modest traction. The move comes as traders position ahead of a busy run of US data and the release of the FOMC Minutes. Adding to the pullback are reports that the ECB’s Lagarde may step down before completing her term.

GBP/USD flirts with daily highs near 1.3580

GBP/USD manages to set aside two consecutive daily declines and trades with slight gains in the 1.3580 zone on Wednesday. Cable’s uptick comes despite acceptable gains in the Greenback and easing UK inflation figures, which seem to have reinforced the case for a BoE rate cut in March.

Gold regains some shine, retargets $5,000 ahead of FOMC Minutes

Gold gathers fresh upside traction on Wednesday, leaving part of the weakness seen at the beginning of the week and refocusing its attention to the key $5,000 mark per troy ounce, all ahead of the release of the FOMC Minutes and despite the modest uptick in the US Dollar.

Pi Network rally defies market pressure ahead of its first anniversary

Pi Network is trading above $0.1900 at press time on Wednesday, extending the weekly gains by nearly 8% so far. The steady recovery is supported by a short-term pause in mainnet migration, which reduces pressure on the PI token supply for Centralized Exchanges. The technical outlook focuses on the $0.1919 resistance as bullish momentum increases.

Mixed UK inflation data no gamechanger for the Bank of England

Food inflation plunged in January, but service sector price pressure is proving stickier. We continue to expect Bank of England rate cuts in March and June. The latest UK inflation read is a mixed bag for the Bank of England, but we doubt it drastically changes the odds of a March rate cut.

Top 3 Price Prediction: Bitcoin, Ethereum, and Ripple face downside risk as bears regain control

Bitcoin, Ethereum, and Ripple remain under pressure on Wednesday, with the broader trend still sideways. BTC is edging below $68,000, nearing the lower consolidating boundary, while ETH and XRP also declined slightly, approaching their key supports.