USD/CHF technical analysis: Repeated bounces off 50% Fibo. keeps bullish bias intact
- USD/CHF nears 100-day SMA amid yet another bounce off 50% Fibonacci retracement.
- 61.8% of Fibonacci retracement adds support to the downside.
With its yet another bounce off 50% Fibonacci retracement of August-October advances, USD/CHF nears 100-day Simple Moving Average (SMA) while taking the bids to 0.9865 amid initial trading on Monday.
Should prices manage to close beyond a 100-day SMA level of 0.9871, early October lows near 0.9900 and 0.9940/43 resistance confluence, including a monthly falling trend line and 23.6% Fibonacci retracement, holds the key to pair’s rise towards 200-day SMA level of 0.9955.
In a case where the quote rallies beyond 0.9955, 1.0000 and the previous month high close to 1.0030 will be the key to watch.
If at all sellers sneak in around 50% Fibonacci retracement level of 0.9843, an extended decline below 61.8% Fibonacci retracement level of 0.9800 is widely anticipated.
Additionally, a sustained trading below 0.9800 could give rise to late-August low, near 0.9715, on the bear’s radar.
USD/CHF daily chart
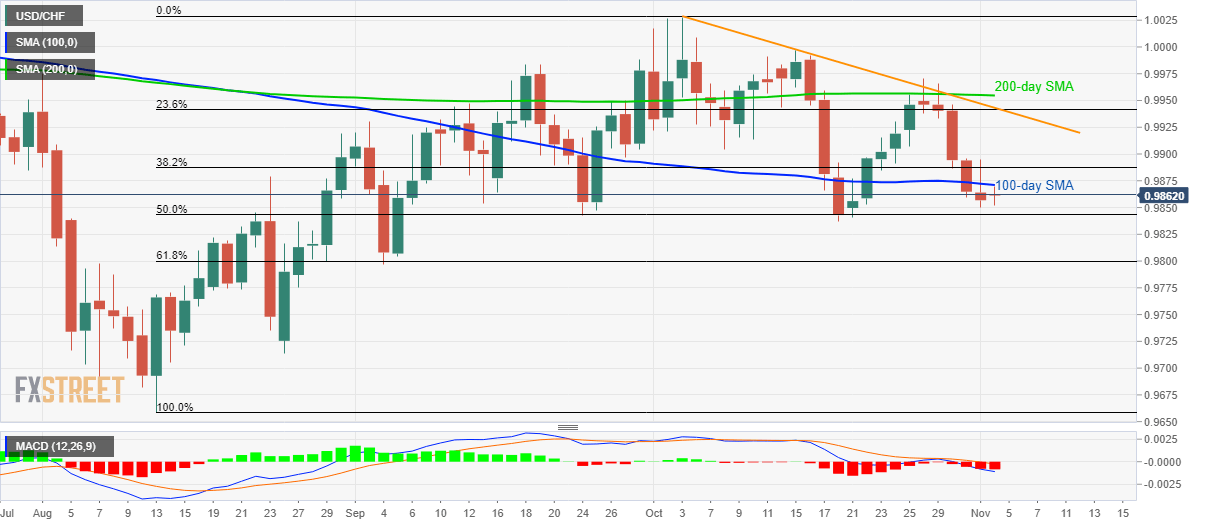
Trend: bullish
Author

Anil Panchal
FXStreet
Anil Panchal has nearly 15 years of experience in tracking financial markets. With a keen interest in macroeconomics, Anil aptly tracks global news/updates and stays well-informed about the global financial moves and their implications.


