USD/CHF technical analysis: Descending triangle inside 200-HMA portrays slow bearish grind
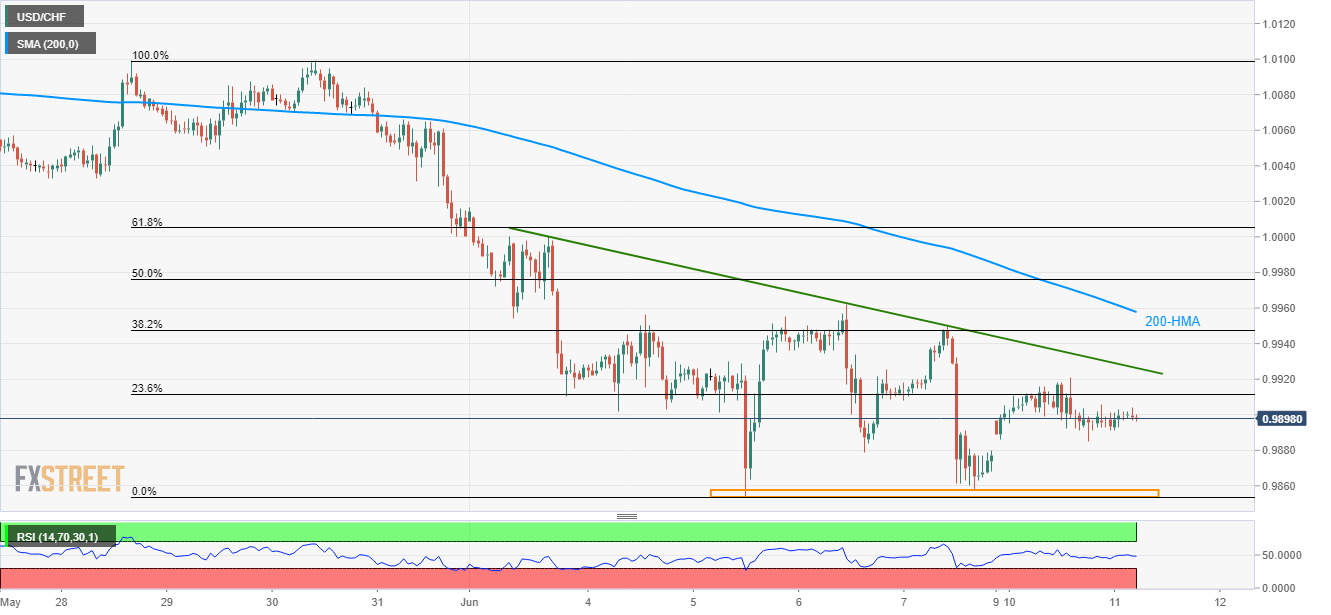
- The sustained trading beneath important resistances signals the pair’s weakness.
- 0.9860/55 is likely crucial support.

Despite lack of momentum, USD/CHF continues to remain under 200-HMA and also follows the short-term descending triangle pattern, which in-turn portrays the slow bearish grind of the pair as it takes the rounds near 0.9900 while heading into Europe open on Tuesday.
While 0.9885 seems immediate support on the downside, 0.9860/55 area comprising recent lows might question sellers targeting mid-January lows around 0.9800.
Additionally, pair’s further weakness beneath 0.9800 might not refrain from declining to 0.9785 and the year 2019 bottom adjacent to 0.9715.
On the contrary, an upside clearance of 0.9926 can escalate the quote’s rise to 200-hour moving average (HMA) level of 0.9960.
In a case where bulls dominate past-0.9960, 61.8% Fibonacci retracement of a latest downpour at 1.0005 seems the key to watch.
USD/CHF hourly chart
Trend: Bearish
Author

Anil Panchal
FXStreet
Anil Panchal has nearly 15 years of experience in tracking financial markets. With a keen interest in macroeconomics, Anil aptly tracks global news/updates and stays well-informed about the global financial moves and their implications.


