|

USD/CHF technical analysis: Buck recovering and Swiss franc dumping help market recovering from monthly lows

  • Investors are dumping the safe-haven Swiss franc as the market mood is improving. 
  • The level to beat for bulls are at 0.9790 and 0.9815 level.
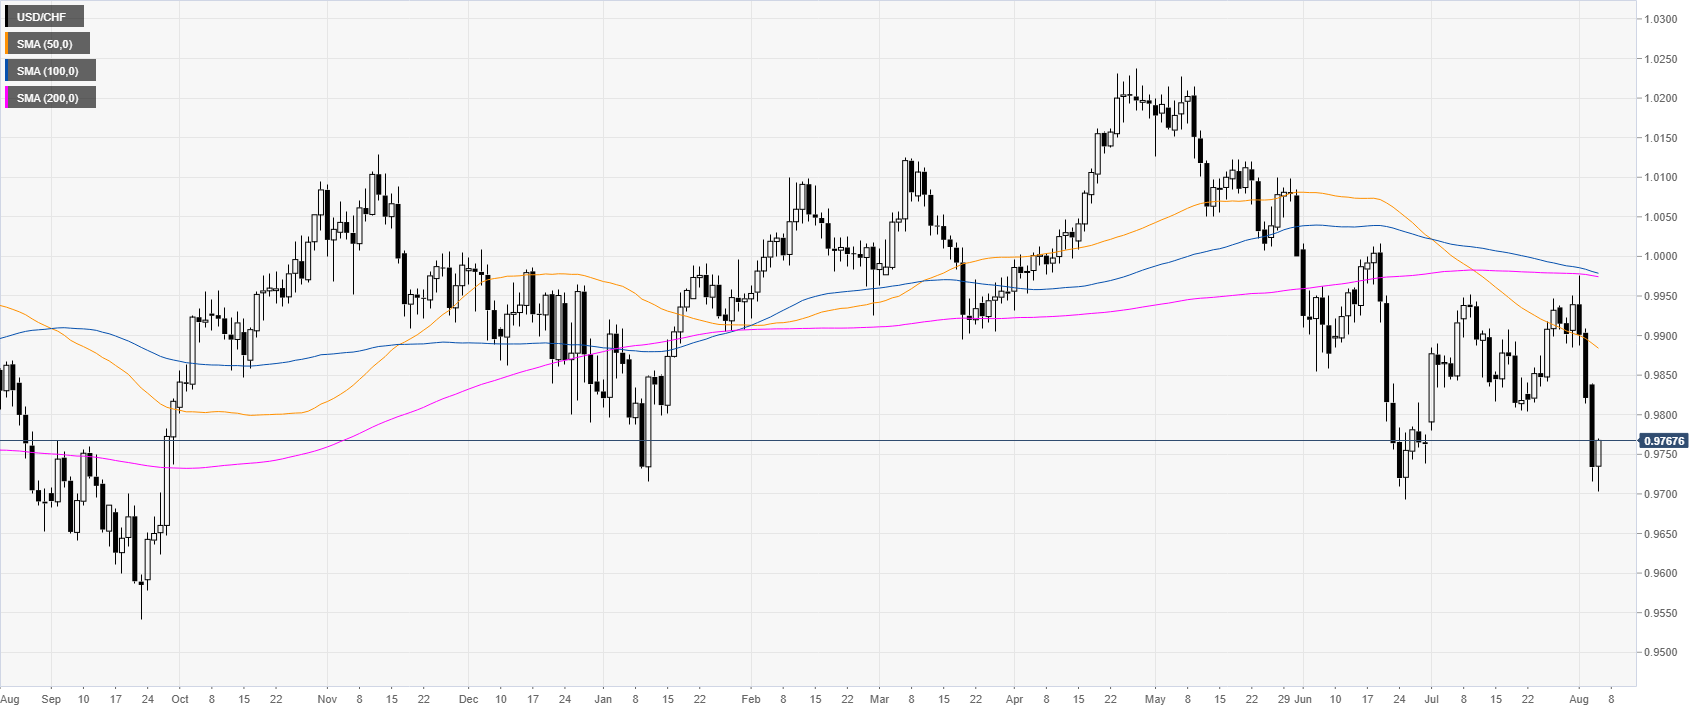
 

USD/CHF daily chart

 
USD/CHF is trading off monthly lows below its main daily simple moving averages (DSMAs). Equity markets are recovering from the selloff seen on Monday as China has re-valued the yuan. Investors are selling the safe-haven Swiss franc and buying the greenback.
 

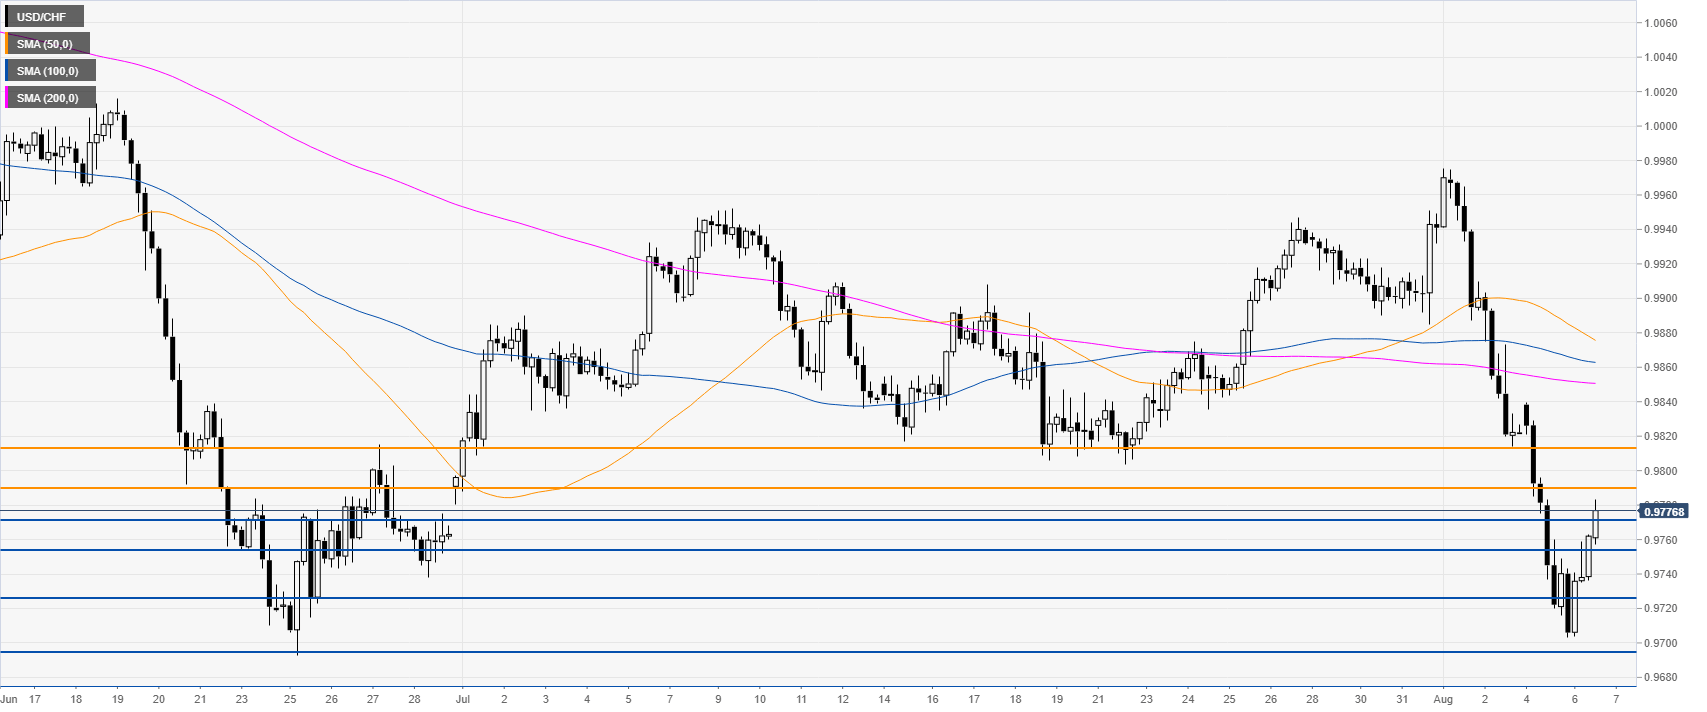
USD/CHF 4-hour chart

 
USD/CHF is bouncing from monthly lows while trading below its main SMAs. Bulls would be looking to extend the recovery beyond 0.9790 and 0.9815 resistances.
  

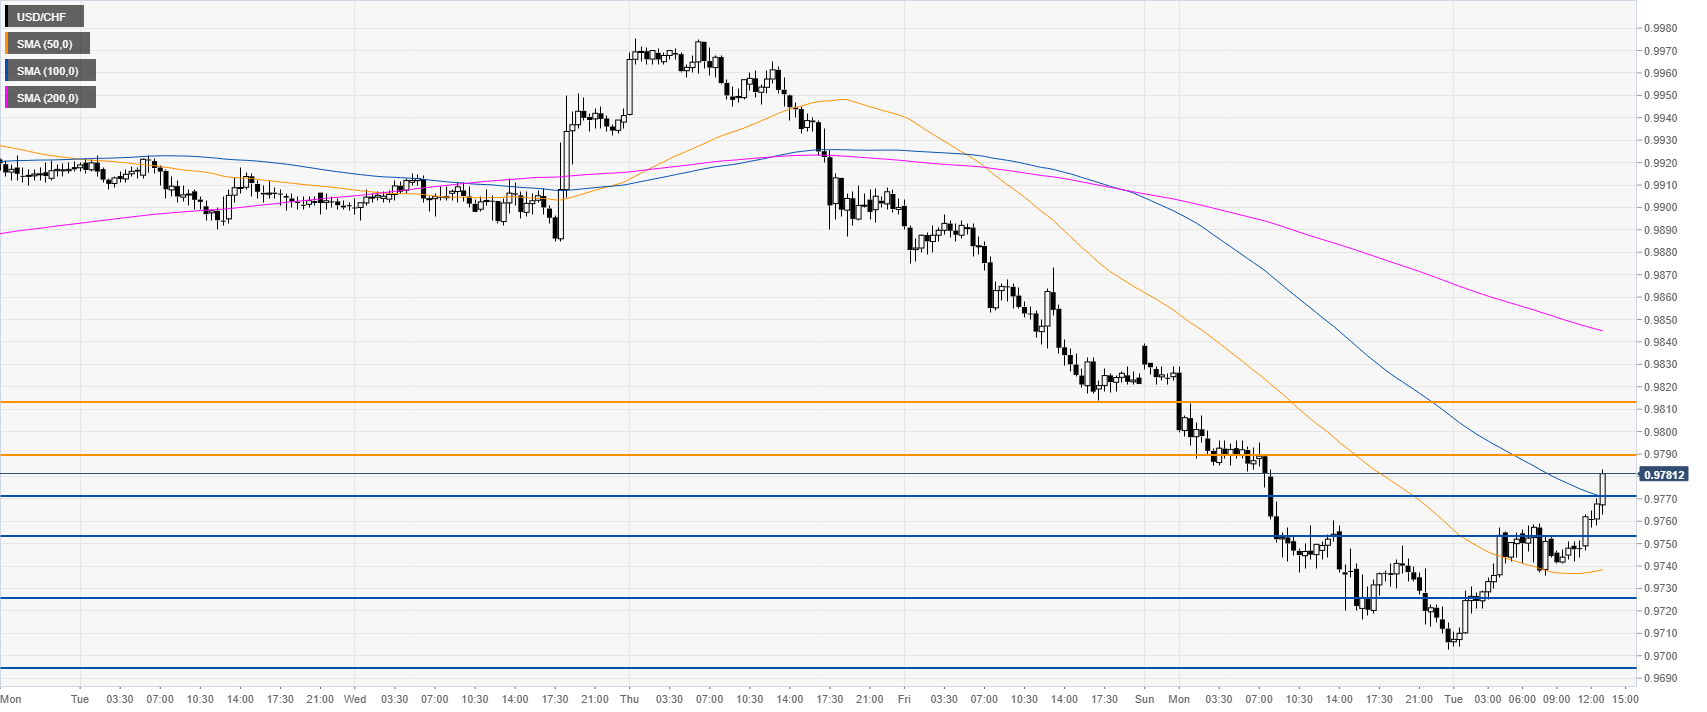
USD/CHF 30-minute chart


USD/CHF is trading above the 50 and 100 SMA, suggesting a pullback up in the near term. Immediate supports are near 0.9770 and 0.9755, according to the Technical Confluences Indicator
 

Additional key levels

USD/CHF

Overview
Today last price0.9781
Today Daily Change0.0047
Today Daily Change %0.48
Today daily open0.9734
 
Trends
Daily SMA200.9869
Daily SMA500.989
Daily SMA1000.9981
Daily SMA2000.9976
Levels
Previous Daily High0.9839
Previous Daily Low0.9716
Previous Weekly High0.9976
Previous Weekly Low0.9814
Previous Monthly High0.9952
Previous Monthly Low0.978
Daily Fibonacci 38.2%0.9763
Daily Fibonacci 61.8%0.9792
Daily Pivot Point S10.9687
Daily Pivot Point S20.964
Daily Pivot Point S30.9563
Daily Pivot Point R10.981
Daily Pivot Point R20.9887
Daily Pivot Point R30.9934

Author

Flavio Tosti

Flavio Tosti

Independent Analyst


More from Flavio Tosti
Share:

Editor's Picks

EUR/USD remains heavy near 1.1600 after hot EU inflation data

EUR/USD remains heavily offered near 1.1600, six-week lows, in the European session on Tuesday. The pair fails to find any inspiration from a surprise pick up in Eurozone inflation for February, as the US Dollar continues to attract safe haven flows amid escalating geopolitical tensions in the Middle East. 

GBP/USD attacks 1.3300, refreshing three-month lows

GBP/USD is deep in the red near 1.3300, accelerating its downside to renew three-month lows in European trading on Tuesday. The ongoing escalation in the Iran war, combined with rising Oil prices, weighs negatively on the higher-yielding Pound Sterling as the US Dollar capitalizes on increased haven demand.

Gold falls below $5,300 as stronger USD counter Middle East woes

Gold attracts some intraday selling and falls below $5,300 on Tuesday. The US Dollar climbs to a fresh high since January 20 and turns out to be a key factor exerting downward pressure on the commodity. However, concerns about a broader regional conflict in the Middle East continue to weigh on investors' sentiment and underpin demand for the traditional safe-haven bullion.

Stellar risks deeper losses as derivatives metrics turn negative

Stellar is trading red below $0.16 at the time of writing on Tuesday, after a slight recovery the previous day. Weakening derivatives data caps the recovery, while an unfavorable technical outlook projects a deeper correction for the XLM token in the upcoming days.

Middle East conflict ramps up a gear as energy price spike rips through markets

It’s another risk off day as geopolitical headwinds continue to batter financial markets. Although markets calmed during the US session and US stocks managed to post gains on Monday, this has not fed through to the European session, and stocks and bonds are sharply lower for a second day.

Hyperliquid Price Forecast: HYPE rises on commodities demand amid US-Iran war

Hyperliquid (HYPE) steadies above $33 at press time on Tuesday, marking its fourth consecutive day of recovery in a broadly volatile market due to the ongoing US-Israel strikes on Iran.