|

USD/CHF Price Prediction: Unfolding bullish leg within range

  • USD/CHF has been oscillating since late August. 
  • It is currently unfolding a bullish leg within that sideways trend.

USD/CHF is trading within a range which began forming after the August lows. It is currently rising up within that range in a bullish leg which has reached about the midpoint of the consolidation.

USD/CHF 4-hour Chart 
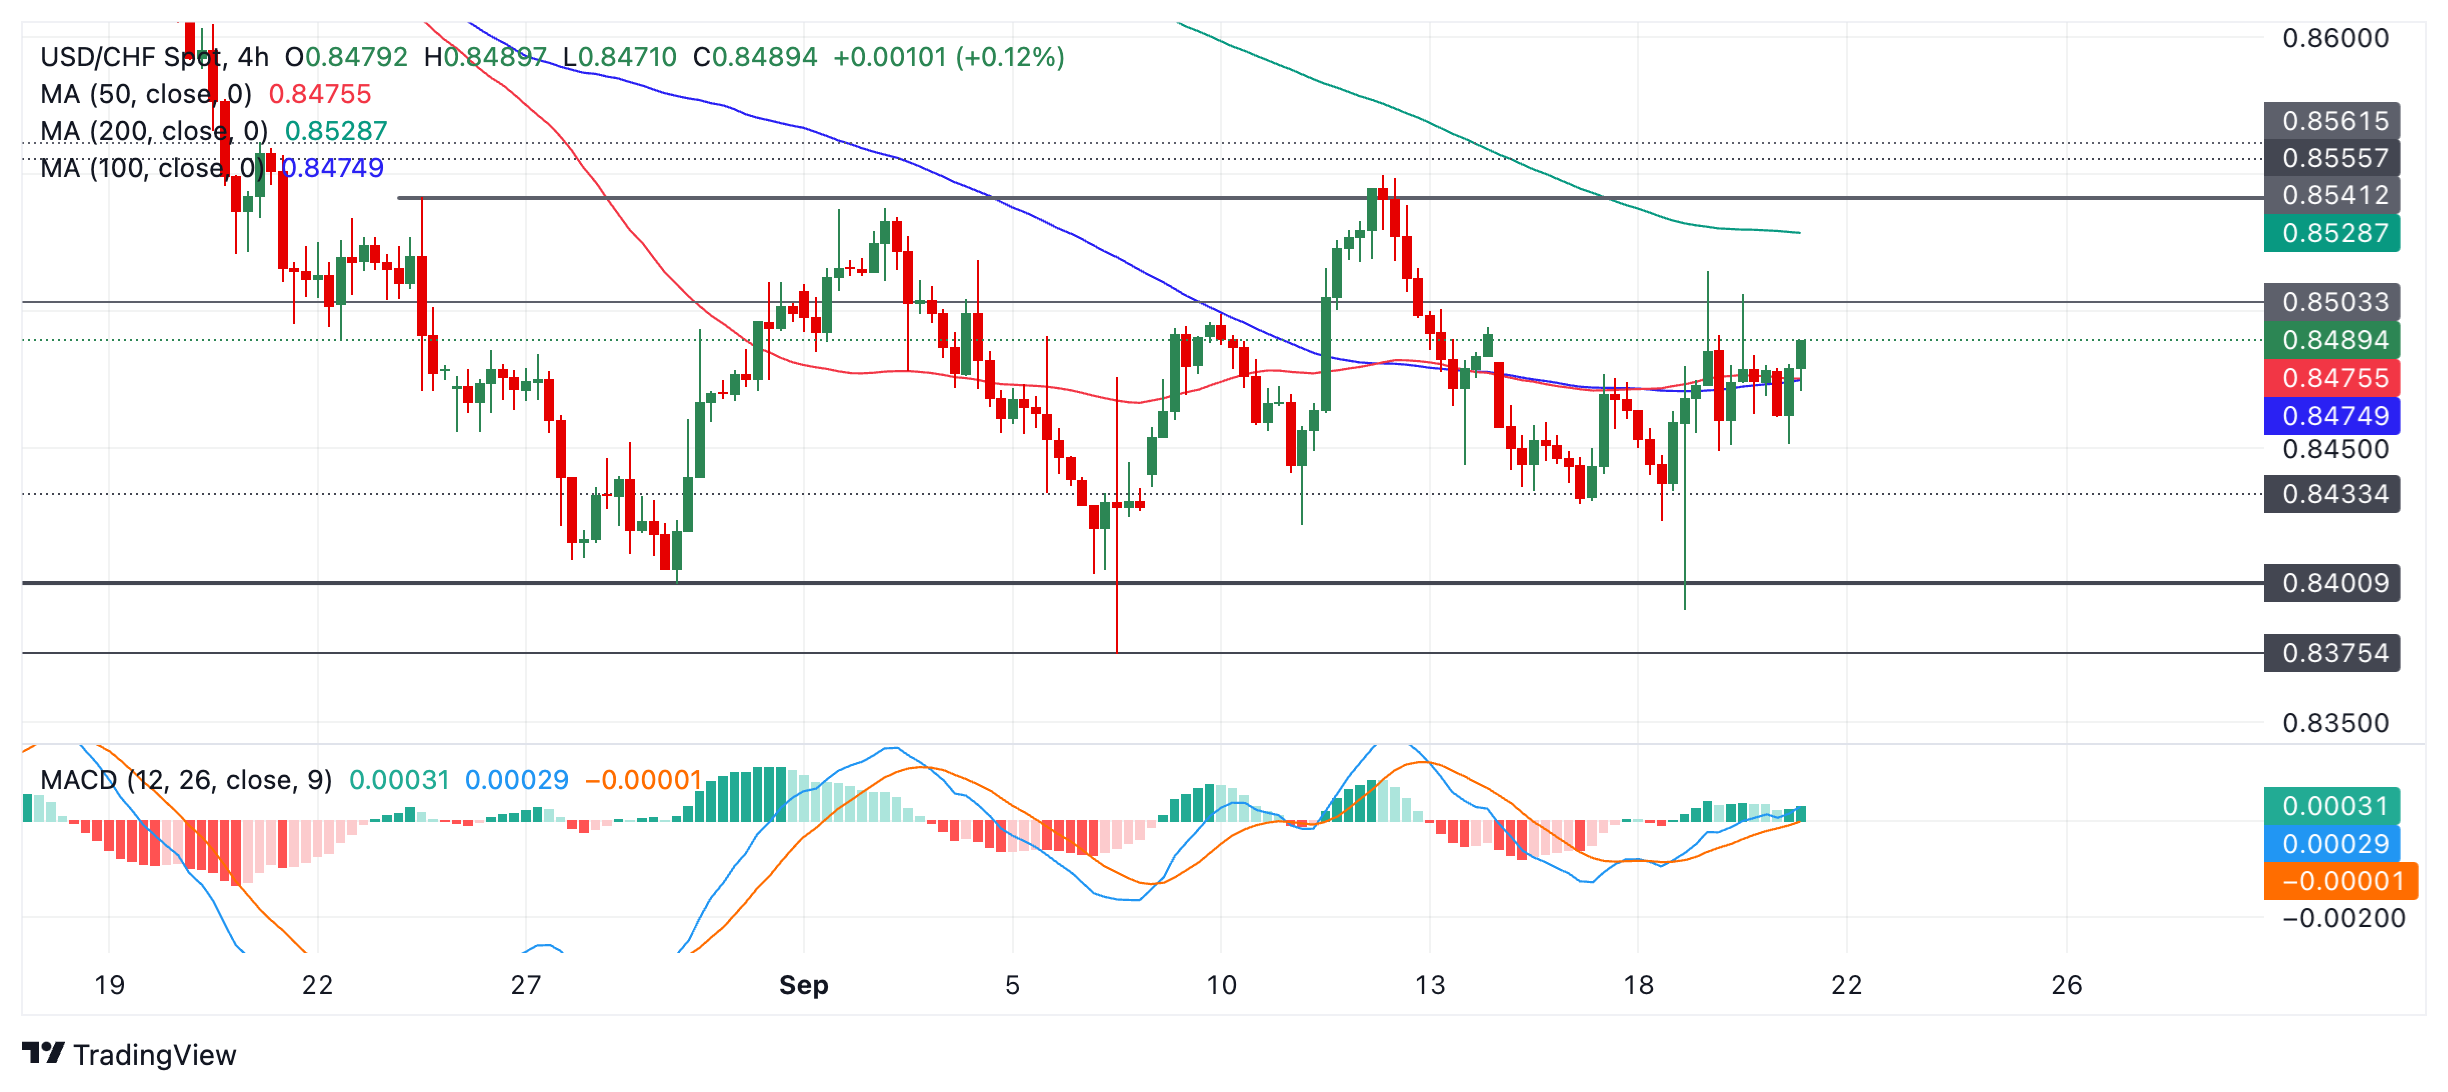
USD/CHF is not in a bullish or bearish trend in the short-term but rather probably a sideways trend. Since it is a principle of technical analysis that “the trend is your friend” the odds favor a continuation of this trend. This suggests the current move up will probably continue until it reaches the range highs before rotating down and continuing the sideways oscillation. 

The Moving Average Convergence Divergence (MACD) momentum indicator has risen above zero which is a bullish sign and suggests a continuation of the up move.  

A break above 0.8515 (September 19 high) would probably provide confirmation of a continuation higher towards the range high at 0.8541.

Author

Joaquin Monfort

Joaquin Monfort is a financial writer and analyst with over 10 years experience writing about financial markets and alt data. He holds a degree in Anthropology from London University and a Diploma in Technical analysis.


More from Joaquin Monfort
Share:

Editor's Picks

GBP/USD advances to three-month peak beyond 1.3600

GBP/USD extends its daily rally and trades at its highest level since mid-May above 1.3600. The US Treasury Department decision to double the sice of liquidity support buyback operations for longer-dated nominal coupon securitiez weighs heavily on the US Dollar and helps the pair push higher. Earlier in the day, the data from the UK showed that annual Consumer Price Index (CPI) inflation picked up to 2.9% in July, meeting estimates, while core CPI rose by 2.6% YoY in July versus 2.5% expected.

EUR/USD surges to 11-week high above 1.1650 after US Treasury announcement

EUR/USD gathers bullish momentum and trades at its highest level since early June above 1.1650 on Wednesday. The US Dollar stays under heavy bearish pressure after the US Treasury announced that it will increase the size of liquidity support buyback operations for longer-dated nominal coupon securities. Later in the day, investors will scrutinize FOMC Minutes for fresh clues on policy outlook.

Gold climbs 2% as US Treasury buyback plan pressures long-term yields

Gold (XAU/USD) enters Wednesday’s American trading hours with decent intraday gains, as a softer US Dollar (USD) and a sharp pullback in long-term US Treasury yields help the metal recover all the previous day’s losses.

Australia unemployment rate expected to hold at 4.4% in July
Australia will release the July monthly employment report on Thursday at 01:30 GMT. Ahead of the announcement, analysts anticipate a modest 15K increase in job creation, while the Unemployment Rate is expected to remain steady at 4.4%.
$20 billion offered, $2 billion taken: Why Treasury doubled its buyback cap
The US Treasury moved off its own calendar on Wednesday, and that is the part worth sitting with. At 12:32 GMT, the department said it would at least double the size of liquidity support buyback operations in the 10-year to 20-year and 20-year to 30-year sectors, lifting the maximum from $2 billion per operation to at least $4 billion, effective September 9 and running to November 4.
Why is Crude Oil priced for a reopening the ships haven't made?
Fourteen vessels crossed the Strait of Hormuz on Tuesday. Before the war, the count ran near 120 a day. In the sessions since the waterway was publicly declared open, Brent has drifted back to $87 and West Texas Intermediate (WTI) to $81, both a little lower again on Wednesday, with daily momentum on each unwound from the top of its range in late July to the low twenties now.