|

USD/CHF Price Prediction: Breakout stalls, pullback forms potential Bull Flag pattern

  • USD/CHF breaks out of range, peaks and corrects. 
  • It may be forming a Bull Flag pattern with further upside potential.  

USD/CHF pulls back after breaking out of its multi-week range and rallying substantially higher on Friday. 

Since breaking out, the pair is now in a short-term uptrend and given it is a key tenet of technical analysis theory that “the trend is your friend” the odds favor a continuation higher. 


USD/CHF 4-hour Chart 

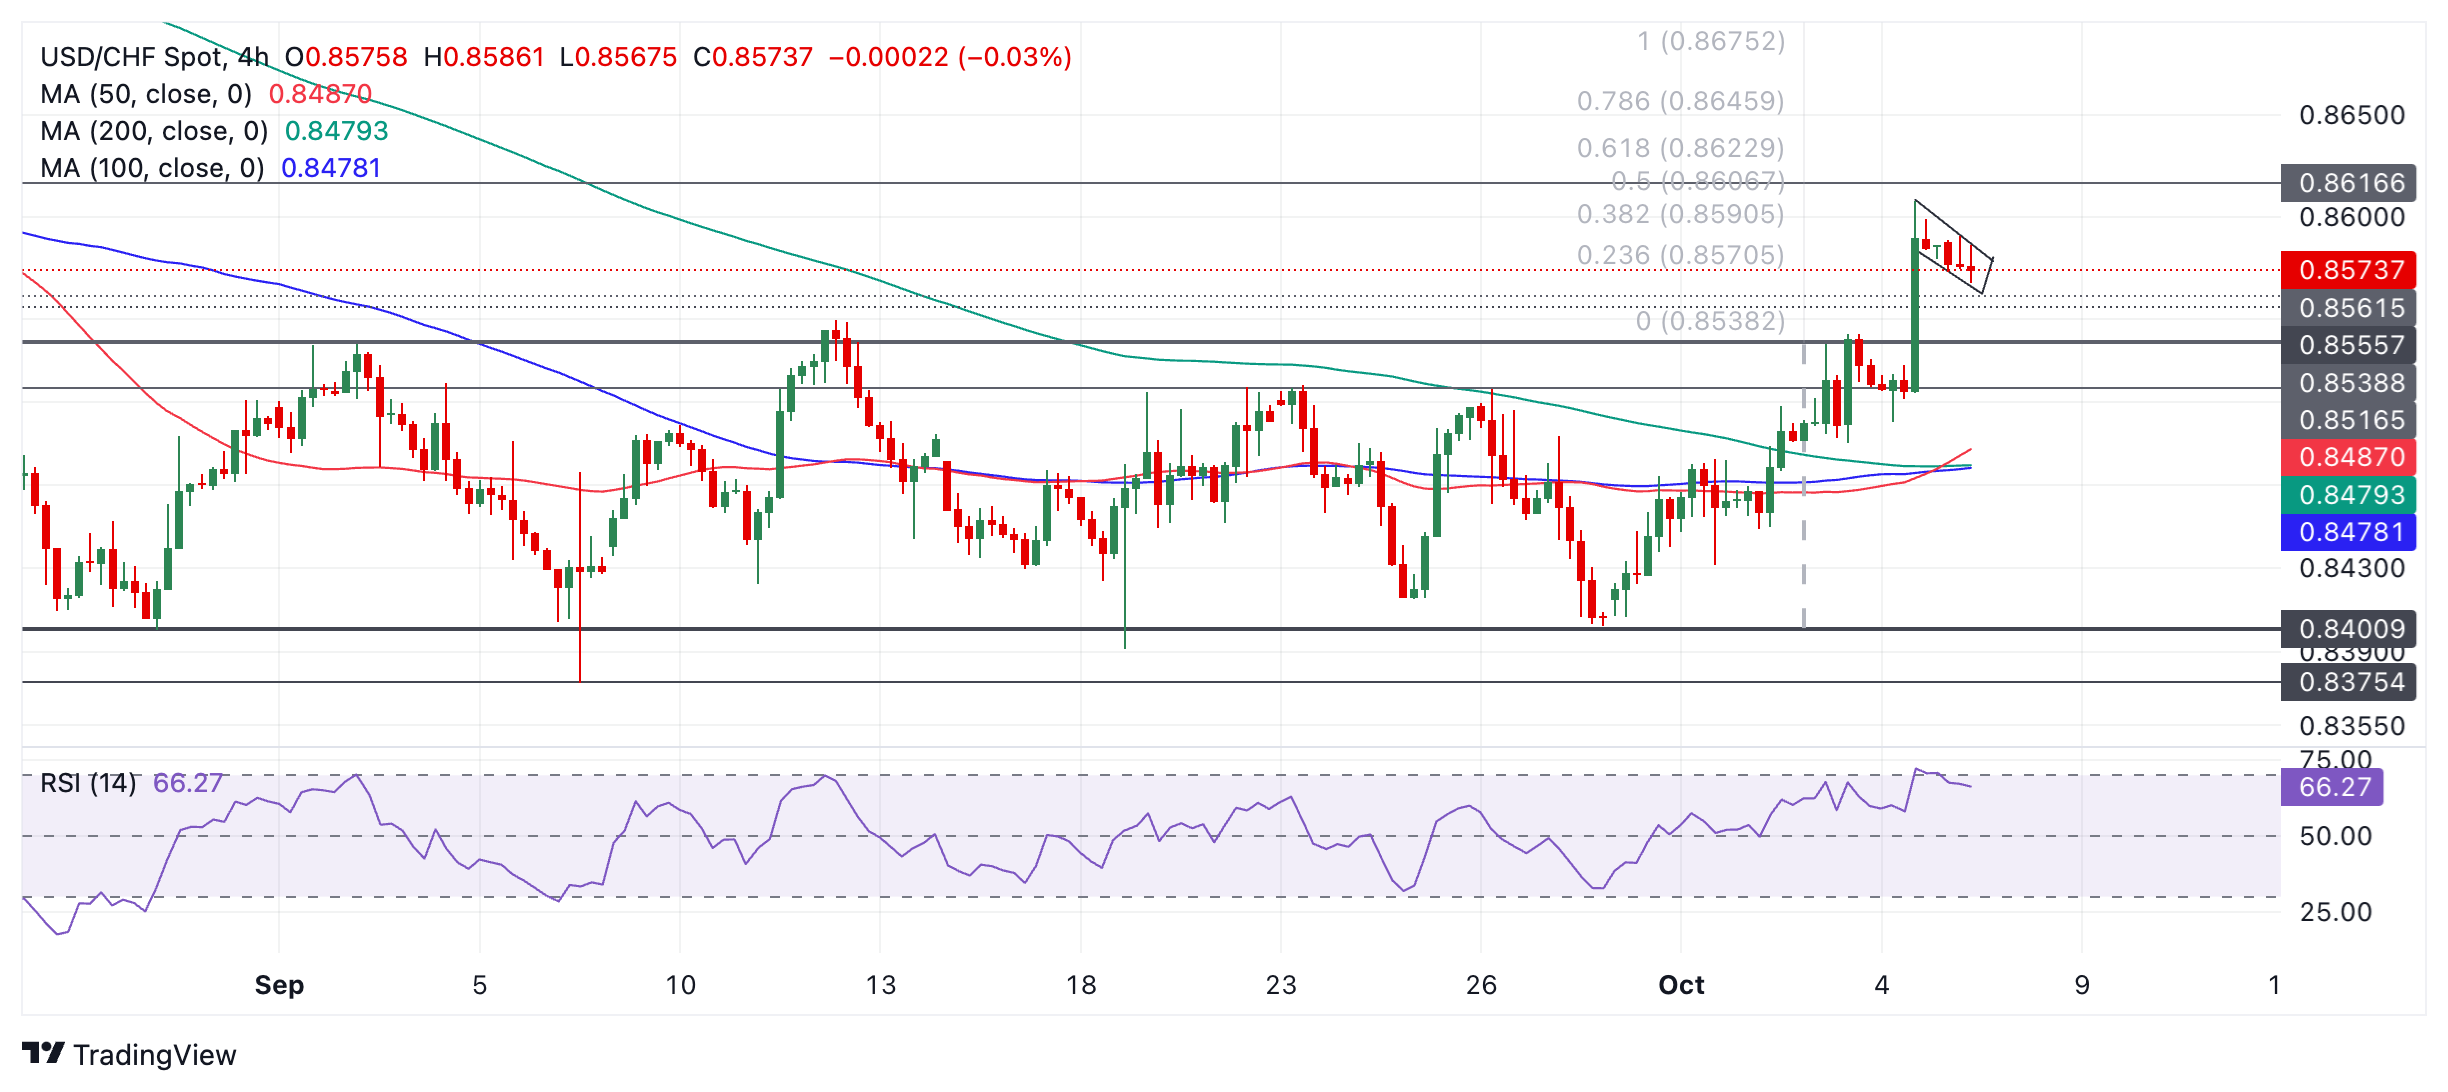
USD/CHF has pulled back over recent periods and in so doing has formed what looks like a Bull Flag pattern. These are composed of a sharp rally called the “pole” and a pullback (the “flag square”). If this is the case then a break above the 0.8607 high of the flag would lead to a rally to around 0.8619 (Fibonacci 61.8% of the pole extrapolated higher) at a minimum and around 0.8650 (100% extrapolation of the pole) as a maximum. 

A minimum upside target also lies at 0.8617 (August 14 swing low), or 0.8622 (Fibonacci 61.8% extrapolation of the height of the prior range higher). A really bullish move could reach 0.8675, the 100% extrapolation of the height of the range. 

The Relative Strength Index (RSI) moved into overbought territory when the breakout rally peaked. It has since come back down into neutral territory during the pullback in price. This is a bearish sign and suggests a deeper correction may develop. Support lies at 0.8550 (September 12 high) and even tougher support at 0.8540 (the top of the range).   

Author

Joaquin Monfort

Joaquin Monfort is a financial writer and analyst with over 10 years experience writing about financial markets and alt data. He holds a degree in Anthropology from London University and a Diploma in Technical analysis.

More from Joaquin Monfort
Share:

Editor's Picks

EUR/USD: US Dollar to remain pressured until uncertainty fog dissipates

Unimpressive European Central Bank left monetary policy unchanged for the fifth consecutive meeting. The United States first-tier employment and inflation data is scheduled for the second week of February. EUR/USD battles to remain afloat above 1.1800, sellers moving to the sidelines.

GBP/USD reclaims 1.3600 and above

GBP/USD reverses two straight days of losses, surpassing the key 1.3600 yardstick on Friday. Cable’s rebound comes as the Greenback slips away from two-week highs in response to some profit-taking mood and speculation of Fed rate cuts. In addition, hawkish comments from the BoE’s Pill are also collaborating with the quid’s improvement.

Gold: Volatility persists in commodity space

After losing more than 8% to end the previous week, Gold remained under heavy selling pressure on Monday and dropped toward $4,400. Although XAU/USD staged a decisive rebound afterward, it failed to stabilize above $5,000. The US economic calendar will feature Nonfarm Payrolls and Consumer Price Index data for January, which could influence the market pricing of the Federal Reserve’s policy outlook and impact Gold’s performance.

Week ahead: US NFP and CPI data to shake Fed cut bets, Japan election looms

US NFP and CPI data awaited after Warsh’s nomination as Fed chief. Yen traders lock gaze on Sunday’s snap election. UK and Eurozone Q4 GDP data also on the agenda. China CPI and PPI could reveal more weakness in domestic demand.

Three scenarios for Japanese Yen ahead of snap election

The latest polls point to a dominant win for the ruling bloc at the upcoming Japanese snap election. The larger Sanae Takaichi’s mandate, the more investors fear faster implementation of tax cuts and spending plans. 

XRP rally extends as modest ETF inflows support recovery

Ripple is accelerating its recovery, trading above $1.36 at the time of writing on Friday, as investors adjust their positions following a turbulent week in the broader crypto market. The remittance token is up over 21% from its intraday low of $1.12.