USD/CHF Price Forecast: Climbs above 20-day SMA, eyes on 0.81
- USD/CHF up 0.56%, trades at 0.8087 after clearing 20-day SMA at 0.8076.
- Technicals show bullish momentum as 20-day SMA crosses above 50-day SMA.
- Break above 0.8100 opens path to 100-day SMA at 0.8149 and August 1 peak at 0.8171.
- Downside risks emerge on failure to hold 20-day SMA; could test 0.8037, 0.8000, and lower prices.

USD/CHF clears the 20-day SMA of 0.8076, rises over 0.56% sponsored by mixed economic data in the US that triggered a reaction by investors, who trimmed dovish Fed bets for the upcoming September meeting. The pair trades at 0.8087, about to crack the 0.81 handle.
USD/CHF Price Forecast: Technical outlook
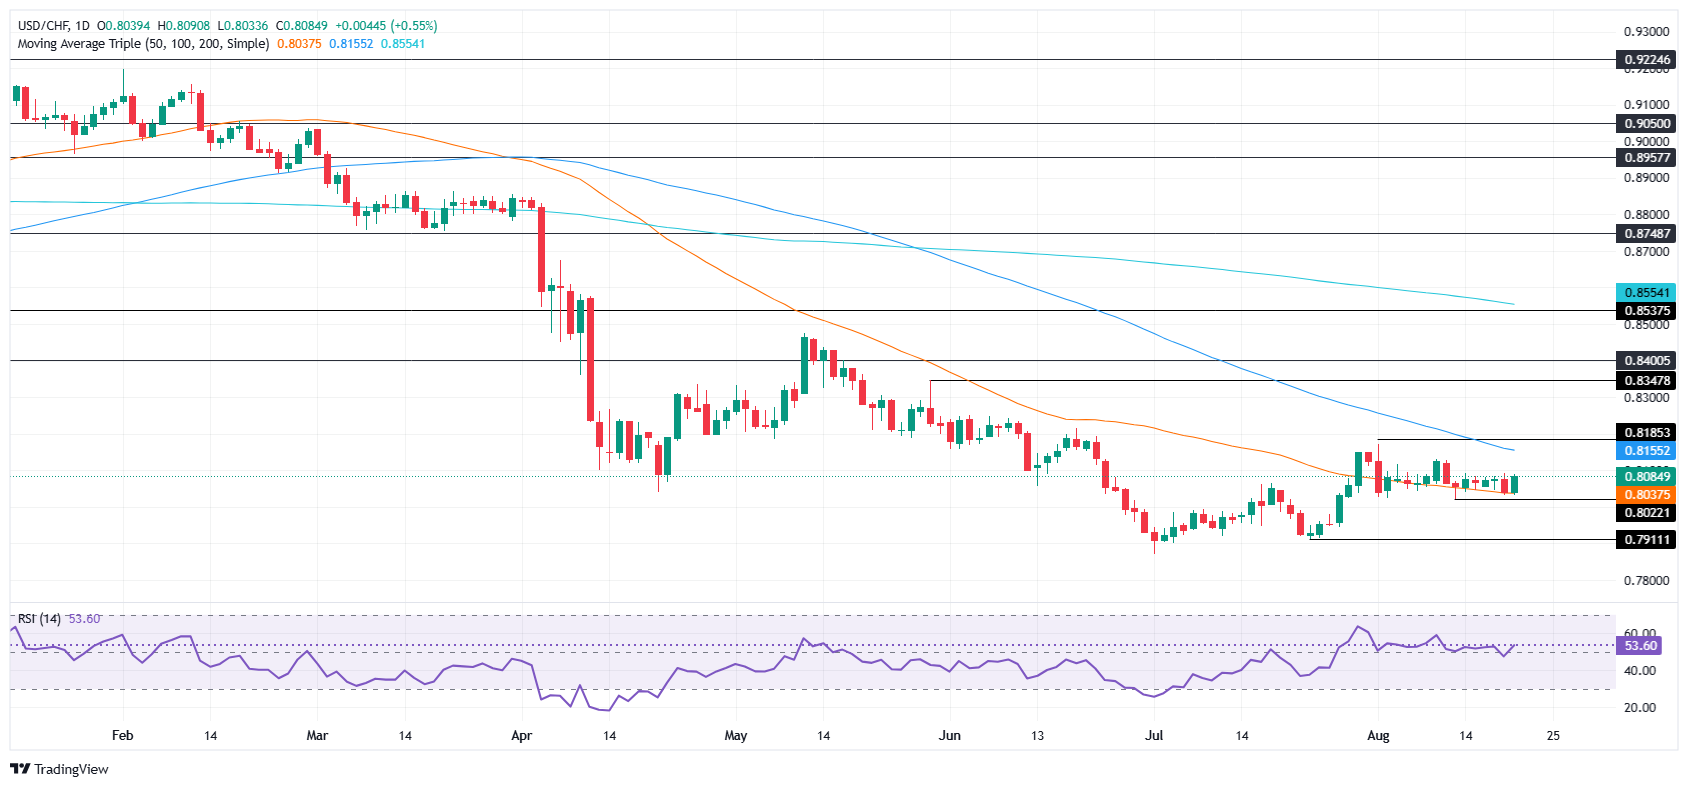
USD/CHF trades sideways, but it seems that it bottomed out at around July’s low of 0.7872. Since then, the pair gained over 2.70%, and a bullish cross of the 20-day SMA above the 50-day SMA at 0.8037 suggests that buyers are gathering steam.
A daily close above 0.8100 clears the path for crucial key resistance levels, like the 100-day SMA at 0.8149 and the August 1 peak at 0.8171. The following areas of interest would be 0.8200 and the May 29 high at 0.8348.
On the other hand, a USD/CHF drop below the 20-day SMA and a move towards the 50-day SMA at 0.8037 is on the cards. On further weakness, the next support would be the 0.800 mark, ahead of testing the July 23 swing low of 0.7911.
USD/CHF Price Chart – Daily
Swiss Franc Price This week
The table below shows the percentage change of Swiss Franc (CHF) against listed major currencies this week. Swiss Franc was the strongest against the New Zealand Dollar.
| USD | EUR | GBP | JPY | CAD | AUD | NZD | CHF | |
|---|---|---|---|---|---|---|---|---|
| USD | 0.89% | 1.04% | 0.82% | 0.66% | 1.37% | 1.82% | 0.36% | |
| EUR | -0.89% | 0.14% | -0.09% | -0.23% | 0.49% | 0.89% | -0.53% | |
| GBP | -1.04% | -0.14% | -0.32% | -0.37% | 0.34% | 0.75% | -0.71% | |
| JPY | -0.82% | 0.09% | 0.32% | -0.13% | 0.57% | 1.03% | -0.45% | |
| CAD | -0.66% | 0.23% | 0.37% | 0.13% | 0.68% | 1.15% | -0.34% | |
| AUD | -1.37% | -0.49% | -0.34% | -0.57% | -0.68% | 0.40% | -1.05% | |
| NZD | -1.82% | -0.89% | -0.75% | -1.03% | -1.15% | -0.40% | -1.48% | |
| CHF | -0.36% | 0.53% | 0.71% | 0.45% | 0.34% | 1.05% | 1.48% |
The heat map shows percentage changes of major currencies against each other. The base currency is picked from the left column, while the quote currency is picked from the top row. For example, if you pick the Swiss Franc from the left column and move along the horizontal line to the US Dollar, the percentage change displayed in the box will represent CHF (base)/USD (quote).
Author

Christian Borjon Valencia
FXStreet
Markets analyst, news editor, and trading instructor with over 14 years of experience across FX, commodities, US equity indices, and global macro markets.


