USD/CHF Price Forecast: Appreciates toward nine-day EMA near 0.8850
- USD/CHF attempts to break above the 14-day EMA at the 0.8832 level.
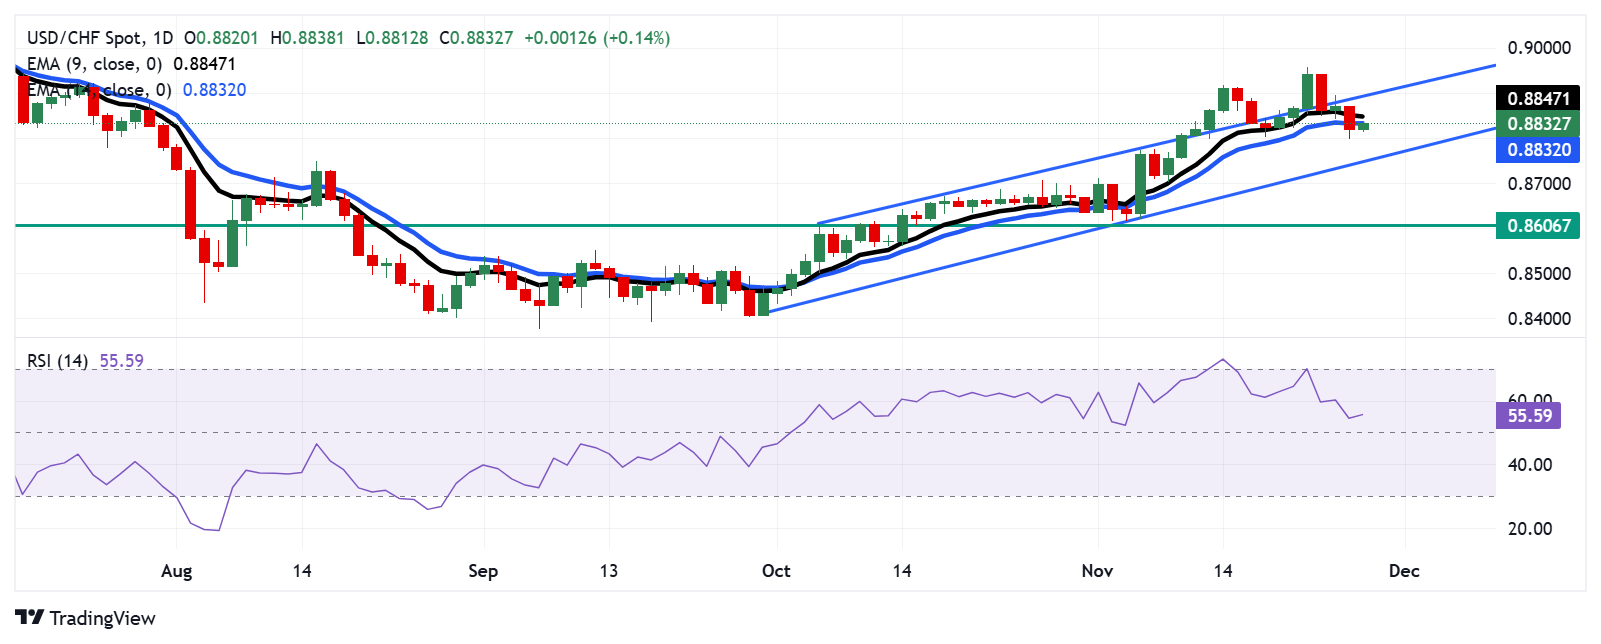
- The daily chart analysis indicates a sustained bullish bias, with the pair trending higher within an ascending channel pattern.
- The pair may navigate the support region around the ascending channel’s lower boundary at 0.8750 level.

The USD/CHF pair retraces recent losses from the previous session, trading around 0.8830 during the Asian hours on Thursday. An analysis of the daily chart suggests an ongoing bullish bias as the pair moves upwards within the ascending channel pattern.
The 14-day Relative Strength Index (RSI) is slightly above 50 level, indicating a bullish market trend. Additionally, the nine-day Exponential Moving Average (EMA) remains above the 14-day EMA, suggesting a bullish bias in the short-term price movement.
On the upside, the USD/CHF pair tests the immediate 14-day EMA at 0.8832 level, followed by the nine-day EMA at 0.8847 level. A successful breach above these levels could further strengthen the bullish bias and support the pair to approach the upper boundary of the ascending channel at a psychological level of 0.8900.
In terms of support, the USD/CHF pair may navigate the region around the lower boundary of the ascending channel at the 0.8750 level. A decisive break below the channel may cause the emergence of the bearish bias and put downward pressure on the pair to approach its six-week low of 0.8606.
USD/CHF: Daily Chart
Swiss Franc PRICE Today
The table below shows the percentage change of Swiss Franc (CHF) against listed major currencies today. Swiss Franc was the strongest against the Japanese Yen.
| USD | EUR | GBP | JPY | CAD | AUD | NZD | CHF | |
|---|---|---|---|---|---|---|---|---|
| USD | 0.11% | 0.10% | 0.27% | 0.00% | 0.13% | 0.05% | 0.15% | |
| EUR | -0.11% | -0.01% | 0.16% | -0.10% | 0.03% | -0.05% | 0.05% | |
| GBP | -0.10% | 0.01% | 0.15% | -0.09% | 0.04% | -0.05% | 0.05% | |
| JPY | -0.27% | -0.16% | -0.15% | -0.27% | -0.15% | -0.26% | -0.13% | |
| CAD | -0.01% | 0.10% | 0.09% | 0.27% | 0.13% | 0.06% | 0.14% | |
| AUD | -0.13% | -0.03% | -0.04% | 0.15% | -0.13% | -0.08% | 0.03% | |
| NZD | -0.05% | 0.05% | 0.05% | 0.26% | -0.06% | 0.08% | 0.10% | |
| CHF | -0.15% | -0.05% | -0.05% | 0.13% | -0.14% | -0.03% | -0.10% |
The heat map shows percentage changes of major currencies against each other. The base currency is picked from the left column, while the quote currency is picked from the top row. For example, if you pick the Swiss Franc from the left column and move along the horizontal line to the US Dollar, the percentage change displayed in the box will represent CHF (base)/USD (quote).
Author

Akhtar Faruqui
FXStreet
Akhtar Faruqui is a Forex Analyst based in New Delhi, India. With a keen eye for market trends and a passion for dissecting complex financial dynamics, he is dedicated to delivering accurate and insightful Forex news and analysis.