• The USD/CHF extends its weekly losses to more than 1%.
  • The divergence between the USD/CHF price action and oscillators could suggest that selling pressure is fading.
  • USD/CHF Price Analysis: Break below 0.9200 to exacerbate a fall to YTD lows; otherwise, a rally above 0.9300 is almost certain.

The USD/CHF prolongs its fall to a fresh seven-month low, ahead of the Federal Reserve monetary policy decision, tumbles below 0.9300 after Tuesday’s volatile session, witnessing further weakness on the US Dollar (USD), spurred by a soft inflation report. Therefore, the USD/CHF so far is down in the week by 1.11%, and on Wednesday down 0.47%, trading at 0.9243 at the time of typing.

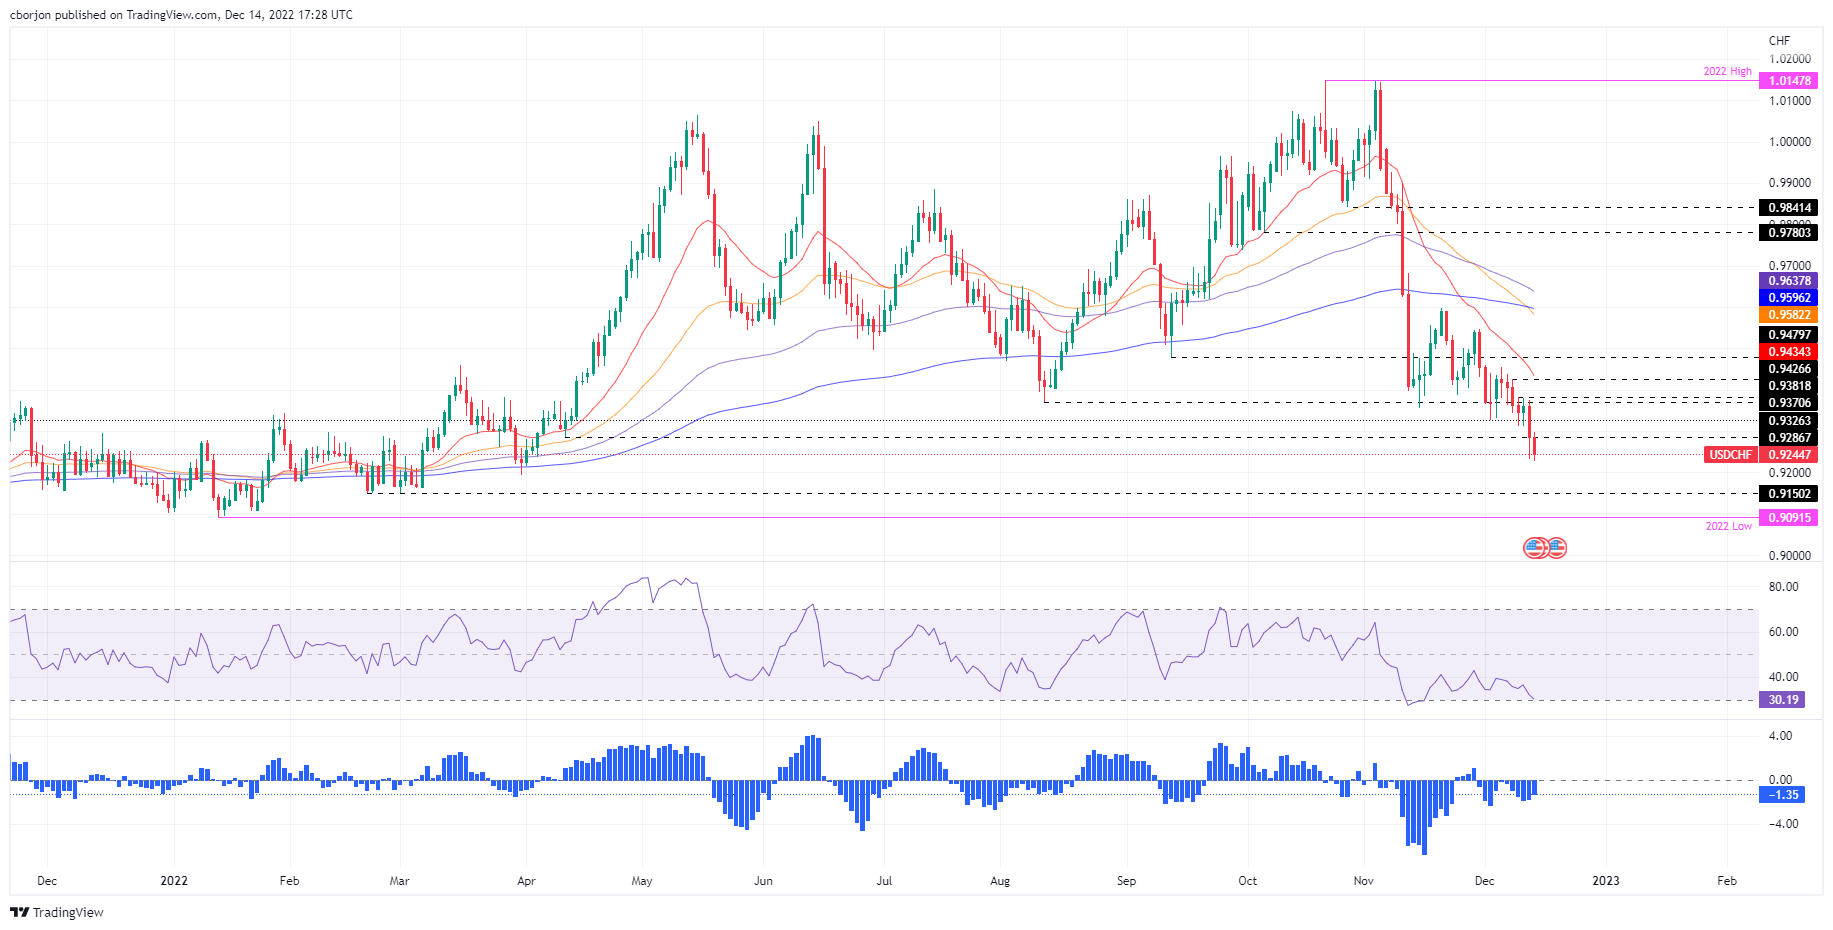
USD/CHF Price Analysis: Technical outlook

The USD/CHF bias remains downwards, as the daily chart depicts, with prices falling to multi-month lows below 0.9300. It should be said that oscillators had barely reacted to price action, with the Relative Strength Index (RSI) remaining slightly above oversold territory. At the same time, the Rate of Change (RoC) continued to aim toward the zero line, suggesting that selling pressure is abating.

Therefore, if the USD/CHF drops below 0.9200, a fall toward February 21 daily low at 0.9150 is on the cards, followed by a re-test of the YTD lows of 0.9091. Nevertheless, with oscillators diverging from the USD/CHF price action, the USD/CHF first resistance would be the 0.9300 psychological level, followed by the December 13 daily high of 0.9375 ahead of the 0.9400 mark.

USD/CHF Key Technical Levels

USD/CHF

Overview
Today last price 0.9245
Today Daily Change -0.0047
Today Daily Change % -0.51
Today daily open 0.9292
 
Trends
Daily SMA20 0.9439
Daily SMA50 0.9715
Daily SMA100 0.9686
Daily SMA200 0.9647
 
Levels
Previous Daily High 0.9375
Previous Daily Low 0.9232
Previous Weekly High 0.9456
Previous Weekly Low 0.9312
Previous Monthly High 1.0148
Previous Monthly Low 0.9357
Daily Fibonacci 38.2% 0.9286
Daily Fibonacci 61.8% 0.932
Daily Pivot Point S1 0.9224
Daily Pivot Point S2 0.9156
Daily Pivot Point S3 0.9081
Daily Pivot Point R1 0.9368
Daily Pivot Point R2 0.9443
Daily Pivot Point R3 0.9511


Share: Feed news

Information on these pages contains forward-looking statements that involve risks and uncertainties. Markets and instruments profiled on this page are for informational purposes only and should not in any way come across as a recommendation to buy or sell in these assets. You should do your own thorough research before making any investment decisions. FXStreet does not in any way guarantee that this information is free from mistakes, errors, or material misstatements. It also does not guarantee that this information is of a timely nature. Investing in Open Markets involves a great deal of risk, including the loss of all or a portion of your investment, as well as emotional distress. All risks, losses and costs associated with investing, including total loss of principal, are your responsibility. The views and opinions expressed in this article are those of the authors and do not necessarily reflect the official policy or position of FXStreet nor its advertisers. The author will not be held responsible for information that is found at the end of links posted on this page.

If not otherwise explicitly mentioned in the body of the article, at the time of writing, the author has no position in any stock mentioned in this article and no business relationship with any company mentioned. The author has not received compensation for writing this article, other than from FXStreet.

FXStreet and the author do not provide personalized recommendations. The author makes no representations as to the accuracy, completeness, or suitability of this information. FXStreet and the author will not be liable for any errors, omissions or any losses, injuries or damages arising from this information and its display or use. Errors and omissions excepted.

The author and FXStreet are not registered investment advisors and nothing in this article is intended to be investment advice.

Recommended content


Recommended content

Editors’ Picks

EUR/USD clings to gains above 1.0750 after US data

EUR/USD clings to gains above 1.0750 after US data

EUR/USD manages to hold in positive territory above 1.0750 despite retreating from the fresh multi-week high it set above 1.0800 earlier in the day. The US Dollar struggles to find demand following the weaker-than-expected NFP data.

EUR/USD News

GBP/USD declines below 1.2550 following NFP-inspired upsurge

GBP/USD declines below 1.2550 following NFP-inspired upsurge

GBP/USD struggles to preserve its bullish momentum and trades below 1.2550 in the American session. Earlier in the day, the disappointing April jobs report from the US triggered a USD selloff and allowed the pair to reach multi-week highs above 1.2600.

GBP/USD News

Gold struggles to hold above $2,300 despite falling US yields

Gold struggles to hold above $2,300 despite falling US yields

Gold stays on the back foot below $2,300 in the American session on Friday. The benchmark 10-year US Treasury bond yield stays in negative territory below 4.6% after weak US data but the improving risk mood doesn't allow XAU/USD to gain traction.

Gold News

Bitcoin Weekly Forecast: Should you buy BTC here? Premium

Bitcoin Weekly Forecast: Should you buy BTC here?

Bitcoin (BTC) price shows signs of a potential reversal but lacks confirmation, which has divided the investor community into two – those who are buying the dips and those who are expecting a further correction.

Read more

Week ahead – BoE and RBA decisions headline a calm week

Week ahead – BoE and RBA decisions headline a calm week

Bank of England meets on Thursday, unlikely to signal rate cuts. Reserve Bank of Australia could maintain a higher-for-longer stance. Elsewhere, Bank of Japan releases summary of opinions.

Read more

Forex MAJORS

Cryptocurrencies

Signatures