|

USD/CHF Price Analysis: Struggles at 0.9400 and drops beyond the 100-DMA

  • USD/CHF plunges below the 100-day EMA, with sellers eyeing the 50-day EMA at 0.9310s.
  • Oscillators remain in negative territory, warranting further downside in the USD/CHF pair.
  • USD/CHF Price Analysis: Sellers reclaiming the 20-day EMA would pave the way to 0.9300.

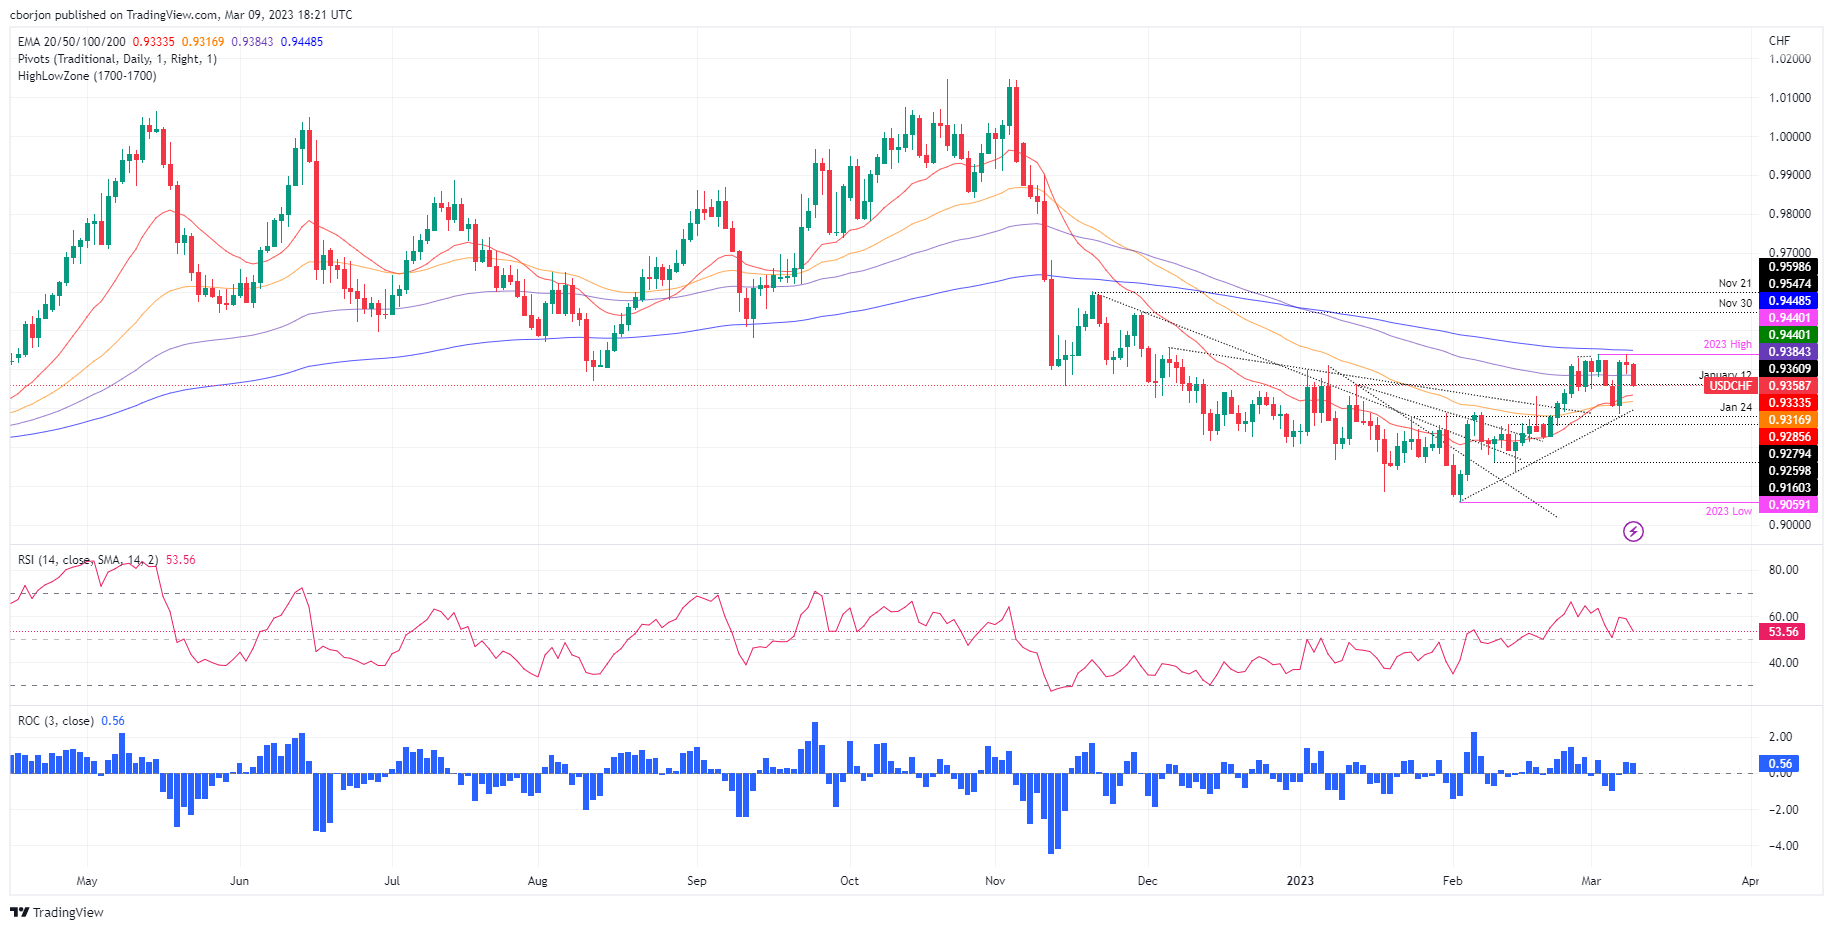
The USD/CHF reverses its upward course and trims some of its weekly gains after the pair was shy of testing the 200-day Exponential Moving Average (EMA) at 0.9448. Consequently, sellers stepped in and tumbled the USD/CHF pair below 0.9400. At the time of typing, the USD/CHF is trading at 0.9357, down 0.59%.

USD/CHF Price action

During Thursday’s session, the USD/CHF retreated below 0.9400, with sellers reclaiming the 100-day EMA at 0.9384. Even though the USD/CHF is falling, it’s facing solid support around 0.93500, which, once cleared, could pave the USD/CHF’s way toward the 20-day EMA at 0.9333. A breach of the latter and the USD/CHF could fall to the 50-day EMA at 0.9316.

Oscillators like the Relative Strength Index (RSI) favor sellers, while the Rate of Change (RoC), portrays buyers losing momentum. Therefore, the USD/CHF could test the 0.9300 figure in the near term.

As an alternate scenario, the USD/CHF first resistance would be the 0.9400 figure. Once broken, the USD/CHF could test the YTD low at 0.9440 before reaching the 200-day EMA at 0.9448.

USD/CHF Daily chart

USD/CHF Technical levels

USD/CHF

Overview
Today last price0.9359
Today Daily Change-0.0053
Today Daily Change %-0.56
Today daily open0.9412
 
Trends
Daily SMA200.9314
Daily SMA500.9265
Daily SMA1000.9417
Daily SMA2000.9564
 
Levels
Previous Daily High0.9439
Previous Daily Low0.9389
Previous Weekly High0.944
Previous Weekly Low0.9342
Previous Monthly High0.9429
Previous Monthly Low0.9059
Daily Fibonacci 38.2%0.9408
Daily Fibonacci 61.8%0.942
Daily Pivot Point S10.9388
Daily Pivot Point S20.9363
Daily Pivot Point S30.9338
Daily Pivot Point R10.9438
Daily Pivot Point R20.9463
Daily Pivot Point R30.9488

Author

Christian Borjon Valencia

Markets analyst, news editor, and trading instructor with over 14 years of experience across FX, commodities, US equity indices, and global macro markets.

More from Christian Borjon Valencia
Share:

Editor's Picks

EUR/USD: Bears retain control below 1.1780-1.1770 confluence breakpoint

The EUR/USD pair remains on the back foot through the Asian session on Friday and currently trades just above mid-1.1700s, well within striking distance of a nearly one-month low set the previous day.

GBP/USD seems vulnerable near one-month low as traders await US data

The GBP/USD pair prolongs its weekly downtrend for the fifth consecutive day on Friday and slides back closer to a nearly one-month low, touched the previous day. Spot prices trade below mid-1.3400s during the Asian session on Friday and seem vulnerable to slide further as traders now look to important US macro data for a fresh impetus.

Gold eyes next breakout on US GDP, PCE inflation data

Gold sticks to recent gains around the $5,000-mark early Friday, biding time before the high-impact US macro events. The focus is now on the US fourth-quarter Gross Domestic Product, core Personal Consumption Expenditures Price Index and the Supreme Court’s ruling on President Donald Trump’s tariffs.

Bitcoin, Ethereum and Ripple remain range-bound as breakdown risks rise

Bitcoin, Ethereum, and Ripple are trading sideways within consolidation ranges on Friday, signaling a lack of directional bias in the broader crypto market. BTC rebounded from key support, and ETH is nearing the lower consolidation boundary, while XRP is holding at its lower trendline boundary. 

Hawkish Fed minutes and a market finding its footing

It was green across the board for US Stock market indexes at the close on Wednesday, with most S&P 500 names ending higher, adding 38 points (0.6%) to 6,881 overall. At the GICS sector level, energy led gains, followed by technology and consumer discretionary, while utilities and real estate posted the largest losses.

Official Trump price approaches breakout with mixed signals from traders

Official Trump (TRUMP) is trading at $3.50 at the time of writing, approaching its upper consolidation range. A breakout from this range could open the door for an upside move. On-chain data shows market indecision, with balanced flows between bulls and bears, signaling a lack of clear directional bias.