- The USD/CHF would finish the week with hefty losses of around 1.48%.
- US equities recording losses reflect a downbeat market mood, boosting the greenback.
- USD/CHF Price Forecast: The bias shifted from upwards to neutral-upwards, consolidating in the 0.9820-80 range.
The Swiss franc remains defensive during the day, failing to recover from heavy losses in the week, which amount to 1.45% so far, with some time ahead of Wall Street’s close. At the time of writing, the USD/CHF is trading at 0.9877 amidst a risk-off market mood.
On Friday, US equities prepare to finish the week on a lower note. In the meantime, US Treasury yields keep pushing higher, led by the 10-year benchmark note at around 3.12%, one bps short of YTD highs.
The US Dollar Index, a measurement of the greenback’s value against a six currencies basket, is pairing early day losses, up 0.04%, currently at 103.589.
During Friday’s trading session, the USD/CHF opened near 0.9850 in the Asian Pacific session and fluctuated in a 30-pip range of 0.9850-80 amid the lack of catalyst as FX traders head into the weekend.
USD/CHF Price Forecast: Technical outlook
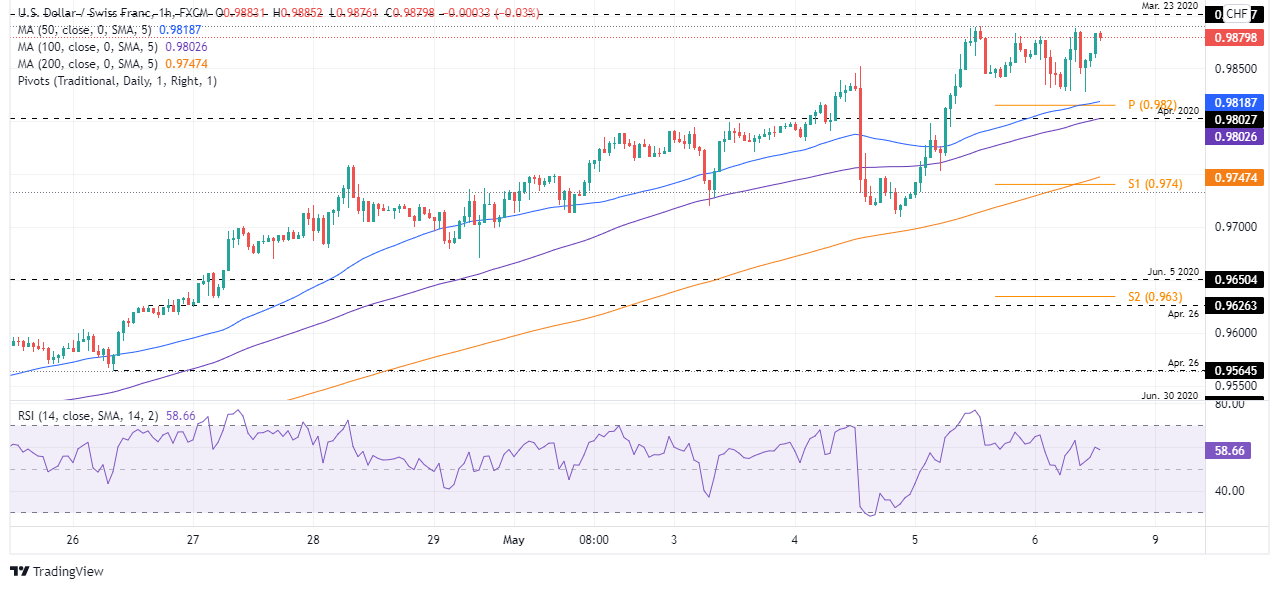
The USD/CHF seems poised to extend its gains towards the next week, despite that the major retreated from YTD highs around 0.9890. The Relative Strength Index (RSI) at 80.33 shows the pair well within overbought territory but is still aiming higher, meaning that a leg-up might be on the cards.
In the meantime, the 1-hour chart shows that once the USD/CHF re<ched 0.9890, 2022’s YTD high consolidated in the 0.9825-90 area. It’s worth noting that the 50, 100, and 200-simple moving averages (SMAs) remain below the spot price, meaning that USD bulls remain in charge.
If the USD/CHF breaks the top of the range, the first resistance would be the 0.9900 mark. Once cleared, the R1 daily pivot would be the next supply zone around 0.9920, followed by the R2 pivot point at the USD/CHF parity.
On the other hand, the USD/CHF first support would be the confluence of the 50-SMA and the daily pivot at around 0.9818-20. A breach of the latter would expose the 100-SMA at 0.9802, followed by the confluence of the S1 daily pivot and the 200-SMA near the 0.9740-47 range.
Key Technical Levels
Information on these pages contains forward-looking statements that involve risks and uncertainties. Markets and instruments profiled on this page are for informational purposes only and should not in any way come across as a recommendation to buy or sell in these assets. You should do your own thorough research before making any investment decisions. FXStreet does not in any way guarantee that this information is free from mistakes, errors, or material misstatements. It also does not guarantee that this information is of a timely nature. Investing in Open Markets involves a great deal of risk, including the loss of all or a portion of your investment, as well as emotional distress. All risks, losses and costs associated with investing, including total loss of principal, are your responsibility. The views and opinions expressed in this article are those of the authors and do not necessarily reflect the official policy or position of FXStreet nor its advertisers. The author will not be held responsible for information that is found at the end of links posted on this page.
If not otherwise explicitly mentioned in the body of the article, at the time of writing, the author has no position in any stock mentioned in this article and no business relationship with any company mentioned. The author has not received compensation for writing this article, other than from FXStreet.
FXStreet and the author do not provide personalized recommendations. The author makes no representations as to the accuracy, completeness, or suitability of this information. FXStreet and the author will not be liable for any errors, omissions or any losses, injuries or damages arising from this information and its display or use. Errors and omissions excepted.
The author and FXStreet are not registered investment advisors and nothing in this article is intended to be investment advice.
Recommended content
Editors’ Picks
AUD/USD risks a deeper drop in the short term
AUD/USD rapidly left behind Wednesday’s decent advance and resumed its downward trend on the back of the intense buying pressure in the greenback, while mixed results from the domestic labour market report failed to lend support to AUD.
EUR/USD leaves the door open to a decline to 1.0600
A decent comeback in the Greenback lured sellers back into the market, motivating EUR/USD to give away the earlier advance to weekly tops around 1.0690 and shift its attention to a potential revisit of the 1.0600 neighbourhood instead.
Gold is closely monitoring geopolitics
Gold trades in positive territory above $2,380 on Thursday. Although the benchmark 10-year US Treasury bond yield holds steady following upbeat US data, XAU/USD continues to stretch higher on growing fears over a deepening conflict in the Middle East.
Bitcoin price shows strength as IMF attests to spread and intensity of BTC transactions ahead of halving
Bitcoin (BTC) price is borderline strong and weak with the brunt of the weakness being felt by altcoins. Regarding strength, it continues to close above the $60,000 threshold for seven weeks in a row.
Is the Biden administration trying to destroy the Dollar?
Confidence in Western financial markets has already been shaken enough by the 20% devaluation of the dollar over the last few years. But now the European Commission wants to hand Ukraine $300 billion seized from Russia.