|

USD/CHF Price Analysis: Slips on US recession woes, capped by the 100-DMA

  • USD/CHF takes a hit as weaker-than-expected US economic data spur recession fears, driving the Swiss Franc up.
  • From a technical perspective, the USD/CHF pair is neutrally biased, awaiting a fresh catalyst for definitive market direction.
  • Amid mixed signals from market oscillators, expectations of a hawkish Swiss National Bank may provide a catalyst for further USD/CHF downside.

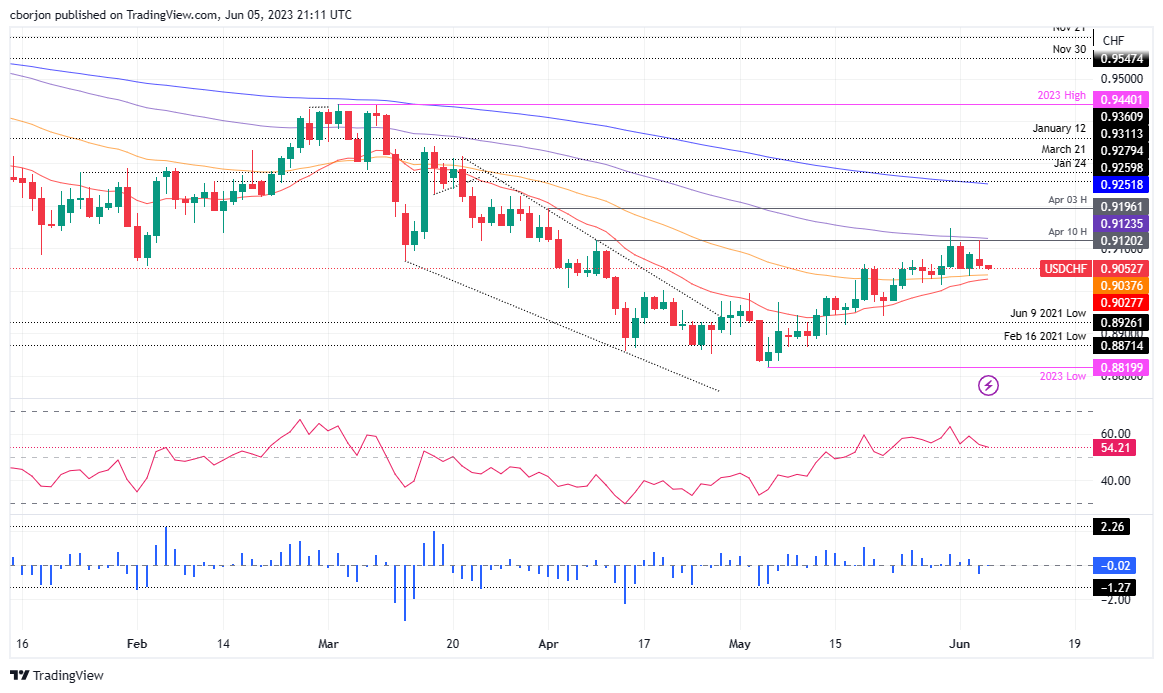
USD/CHF slips after clashing with the 100-day Exponential Moving Average (EMA) at 0.9125, dropping below the 0.9100 mark, sponsored by a soft US Dollar (USD). Weaker-than-expected US economic data stirred recession fears amongst investors. Therefore, the Swiss Franch (CHF) rises, as shown by the USD/CHF pair trading at 0.9063, down 0.27%.

USD/CHF Price Analysis: Technical outlook

From a daily chart perspective, the USD/CHF is neutrally biased, waiting for a fresh catalyst that could give direction to the USD/CHF pair. Meanwhile, the USD/CHF is trapped on the upside by the 100-day Exponential Moving Average (EMA) at 0.9123; on the flip side, the 50-day EMA is at 0.9037.

In bullish territory, the Relative Strength Index (RSI) indicator aims downwards, while the 3-day Rate of Change (RoC), even though in bearish territory, climbs toward the neutral area. Mixed signals between oscillators might prevent traders from opening new long/short positions. But, expectations for a hawkish Swiss National Bank (SNB) could open the door for further downside.

The USD/CHF first support would be the 50-day EMA. A breach of the latter will expose the 20-day EMA at 0.9027, followed by the 0.9000 psychological support, before diving toward February 16, 2021, Low of 0.8926.

USD/CHF Price Action – Daily chart

USD/CHF Daily chart

USD/CHF

Overview
Today last price0.9062
Today Daily Change-0.0030
Today Daily Change %-0.33
Today daily open0.9092
 
Trends
Daily SMA200.9004
Daily SMA500.9001
Daily SMA1000.9127
Daily SMA2000.9376
 
Levels
Previous Daily High0.9093
Previous Daily Low0.9035
Previous Weekly High0.9148
Previous Weekly Low0.9014
Previous Monthly High0.9148
Previous Monthly Low0.882
Daily Fibonacci 38.2%0.9071
Daily Fibonacci 61.8%0.9057
Daily Pivot Point S10.9054
Daily Pivot Point S20.9015
Daily Pivot Point S30.8996
Daily Pivot Point R10.9112
Daily Pivot Point R20.9131
Daily Pivot Point R30.917

Author

Christian Borjon Valencia

Christian Borjon began his career as a retail trader in 2010, mainly focused on technical analysis and strategies around it. He started as a swing trader, as he used to work in another industry unrelated to the financial markets.

More from Christian Borjon Valencia
Share:

Markets move fast. We move first.

Orange Juice Newsletter brings you expert driven insights - not headlines. Every day on your inbox.

By subscribing you agree to our Terms and conditions.

Editor's Picks

EUR/USD climbs toward 1.1800 on broad USD weakness

EUR/USD gathers bullish momentum and advances toward 1.1800 in the second half of the day on Tuesday. The US Dollar weakens and helps the pair stretch higher after the employment report showed that Nonfarm Payrolls declined by 105,000 in October before rising by 64,000 in November.

GBP/USD climbs to fresh two-month high above 1.3400

GBP/USD gains traction in the American session and trades at its highest level since mid-October above 1.3430. The British Pound benefits from upbeat PMI data, while the US Dollar struggles to find demand following the mixed employment figures and weaker-than-forecast PMI prints, allowing the pair to march north.

Gold extends its consolidative phase around $4,300

Gold trades in positive above $4,300 after spending the first half of the day under bearish pressure. XAU/USD capitalizes on renewed USD weakness after the jobs report showed that the Unemployment Rate climbed to 4.6% in November and the PMI data revealed a loss of growth momentum in the private sector in December. 

US Retail Sales virtually unchanged at $732.6 billion in October

Retail Sales in the United States were virtually unchanged at $732.6 billion in October, the US Census Bureau reported on Tuesday. This print followed the 0.1% increase (revised from 0.3%) recorded in September and came in below the market expectation of +0.1%.

Ukraine-Russia in the spotlight once again

Since the start of the week, gold’s price has moved lower, but has yet to erase the gains made last week. In today’s report we intend to focus on the newest round of peace talks between Russia and Ukraine, whilst noting the release of the US Employment data later on day and end our report with an update in regards to the tensions brewing in Venezuela.

BNB Price Forecast: BNB slips below $855 as bearish on-chain signals and momentum indicators turn negative

BNB, formerly known as Binance Coin, continues to trade down around $855 at the time of writing on Tuesday, after a slight decline the previous day. Bearish sentiment further strengthens as BNB’s on-chain and derivatives data show rising retail activity.