• The USD/CHF retreats from 0.9886 in a volatile session, despite positive US data.
  • The Swiss franc has gained almost 1% in the last two trading days.
  • USD/CHF Price Analysis: Sellers are eyeing 0.9700, which would open the door for buyers to lift the pair towards 0.9800.

The USD/CHF dives after reaching a weekly high on Thursday, around 0.9900, and plunges towards the 0.9770s region on upbeat US data, which pared expectations of a Federal Reserve larger-than-expected rate hike, which was cheered by investors, as reflected by global equities rising.

The USD/CHF is trading at 0.9775, near the daily lows, after hitting a 0.9840 daily high, just above the daily pivot, which once broken, paved the way for a free fall below 0.9800, and further extending towards the S1 pivot area around 0.9773.

USD/CHF Price Analysis: Technical outlook
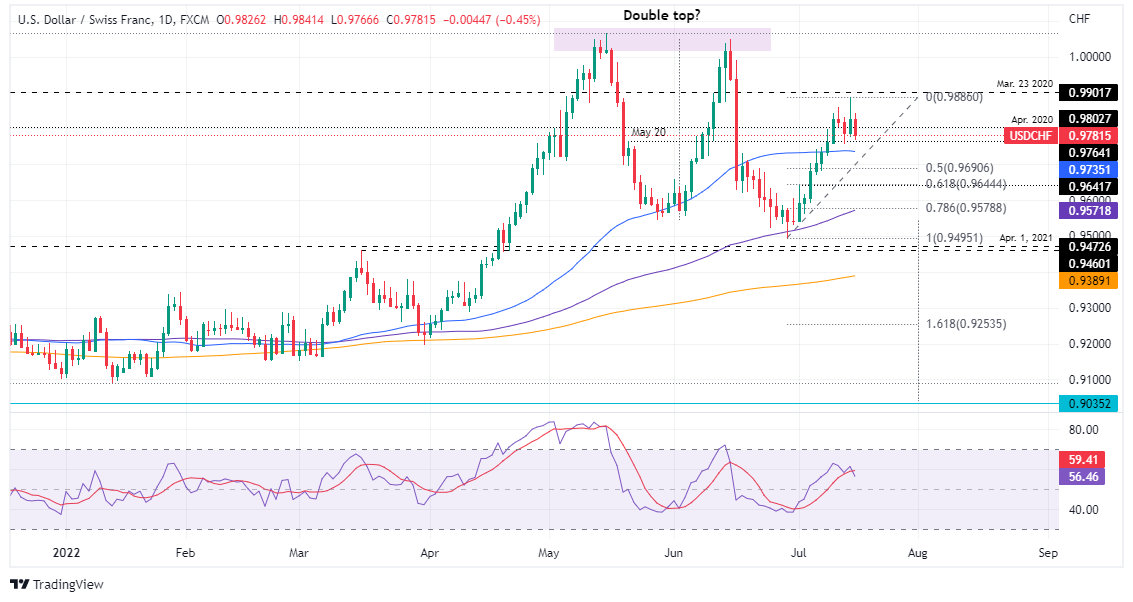
USD/CHF Daily chart

The USD/CHF daily chart shows that it is still favoring longs. The ongoing pullback from weekly highs near 0.9900 could be capped around the 50-day moving average (DMA) at 0.9735, though the Relative Strength Index (RSI) at 56.03 keeps pushing lower, which means that sellers might be eyeing the 50% Fibonacci retracement at around 0.9690, looking forward for an RSI’s uptick, that could give buyers a go, to re-enter USD/CHF longs.

If that scenario plays out, USD/CHF’s first resistance would be 0.9700, followed by 0.9735 and 0.9800. Otherwise, the USD/CHF pullback could continue its fall towards the 61.8% Fibonacci level at 0.9644, followed by the figure at 0.9600.

USD/CHF Key Technical Levels

USD/CHF

Overview
Today last price 0.9778
Today Daily Change -0.0061
Today Daily Change % -0.62
Today daily open 0.9839
 
Trends
Daily SMA20 0.9673
Daily SMA50 0.9742
Daily SMA100 0.957
Daily SMA200 0.9391
 
Levels
Previous Daily High 0.9886
Previous Daily Low 0.9779
Previous Weekly High 0.9798
Previous Weekly Low 0.9562
Previous Monthly High 1.005
Previous Monthly Low 0.9495
Daily Fibonacci 38.2% 0.9845
Daily Fibonacci 61.8% 0.982
Daily Pivot Point S1 0.9783
Daily Pivot Point S2 0.9728
Daily Pivot Point S3 0.9676
Daily Pivot Point R1 0.989
Daily Pivot Point R2 0.9941
Daily Pivot Point R3 0.9997


Share: Feed news

Information on these pages contains forward-looking statements that involve risks and uncertainties. Markets and instruments profiled on this page are for informational purposes only and should not in any way come across as a recommendation to buy or sell in these assets. You should do your own thorough research before making any investment decisions. FXStreet does not in any way guarantee that this information is free from mistakes, errors, or material misstatements. It also does not guarantee that this information is of a timely nature. Investing in Open Markets involves a great deal of risk, including the loss of all or a portion of your investment, as well as emotional distress. All risks, losses and costs associated with investing, including total loss of principal, are your responsibility. The views and opinions expressed in this article are those of the authors and do not necessarily reflect the official policy or position of FXStreet nor its advertisers. The author will not be held responsible for information that is found at the end of links posted on this page.

If not otherwise explicitly mentioned in the body of the article, at the time of writing, the author has no position in any stock mentioned in this article and no business relationship with any company mentioned. The author has not received compensation for writing this article, other than from FXStreet.

FXStreet and the author do not provide personalized recommendations. The author makes no representations as to the accuracy, completeness, or suitability of this information. FXStreet and the author will not be liable for any errors, omissions or any losses, injuries or damages arising from this information and its display or use. Errors and omissions excepted.

The author and FXStreet are not registered investment advisors and nothing in this article is intended to be investment advice.

Recommended content


Recommended content

Editors’ Picks

EUR/USD turns negative near 1.0760

EUR/USD turns negative near 1.0760

The sudden bout of strength in the Greenback sponsored the resurgence of the selling pressure in the risk complex, dragging EUR/USD to the area of daily lows near 1.0760.

EUR/USD News

GBP/USD comes under pressure and challenges 1.2500

GBP/USD comes under pressure and challenges 1.2500

GBP/USD now rapidly loses momentum and gives away initial gains, returning to the 1.2500 region on the back of the strong comeback of the US Dollar.

GBP/USD News

Gold retreats from highs on stronger Dollar, yields

Gold retreats from highs on stronger Dollar, yields

XAU/USD trims part of its initial advance in response to the jump in the Dollar's buying interest and the re-emergence of the upside pressure in US yields.

Gold News

XRP tests support at $0.50 as Ripple joins alliance to work on blockchain recovery

XRP tests support at $0.50 as Ripple joins alliance to work on blockchain recovery

XRP trades around $0.5174 early on Friday, wiping out gains from earlier in the week, as Ripple announced it has joined an alliance to support digital asset recovery alongside Hedera and the Algorand Foundation. 

Read more

Week ahead – US inflation numbers to shake Fed rate cut bets

Week ahead – US inflation numbers to shake Fed rate cut bets

Fed rate-cut speculators rest hopes on US inflation data. After dovish BoE, pound traders turn to UK job numbers. Will a strong labor market convince the RBA to hike? More Chinese data on tap amid signs of slow Q2 start.

Read more

Forex MAJORS

Cryptocurrencies

Signatures