|

USD/CHF Price Analysis: Recovers but stills under the 200-DMA

  • The USD/CHF is set to finish the week with losses of 2.05%.
  • From a daily chart perspective, the major is downwards, as sellers target March’s 31 low below 0.9200.
  • Despite a positive divergence in the hourly chart, the USD/CHF pierced the 200-DMA, but sellers piling at the 200-DMA dragged the pair lower.

The USD/CHF trims Thursday’s losses yet remains below the 200-day EMA, after hitting a daily high at 0.9450, but retraced towards the current price level, but still above the opening price. At the time of writing, the USD/CHF is trading at 0.9418, up by 0.13%.

Traders’ sentiment is upbeat, with US equities rallying sharply. The greenback recovers some ground, as shown by the US Dollar Index up 0.54%, at 105.662, after an improvement in US consumer sentiment eases the US Federal Reserve pressures.

USDCHF Price Analysis: Technical outlook

From a daily chart perspective, the USD/CHF daily chart illustrates the pair as downward biased, with sellers remaining in control, despite buyers lifting the major towards its daily high. Nevertheless, backed by the Relative Strength Index (RSI) at 35.91, well below the 50 midlines, a dip towards the March 31 swing low at 0.9194 is on the cards.

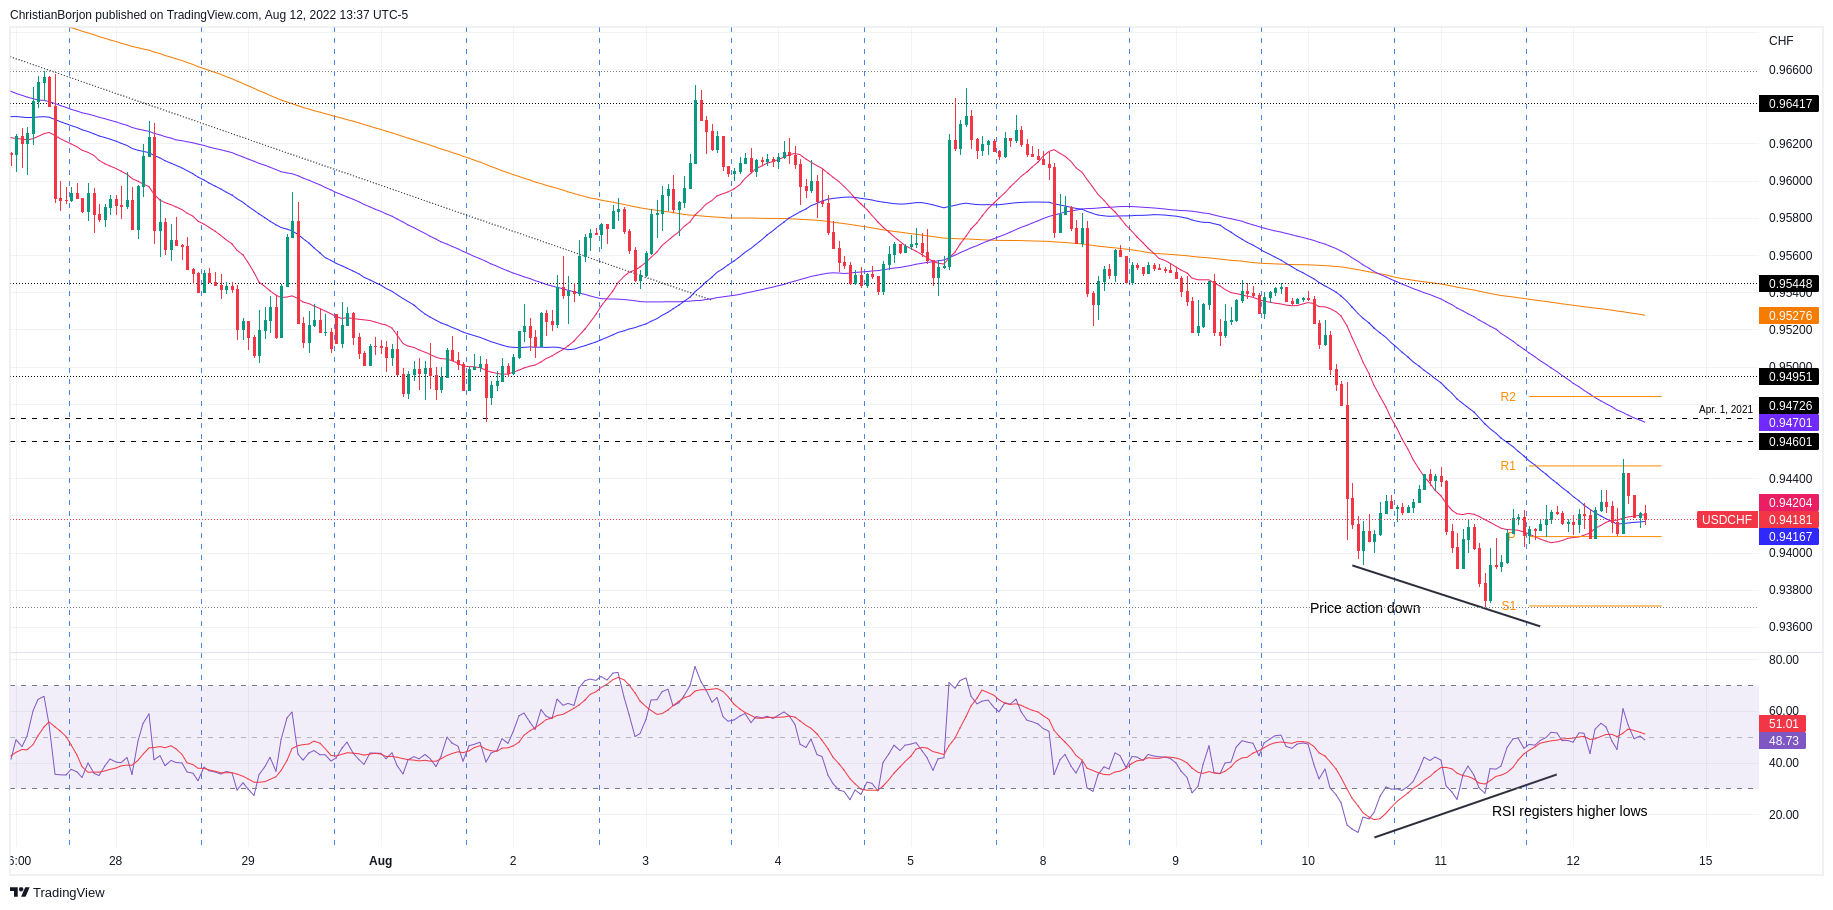
In the one-hour scale, the USD/CHF portrays a positive divergence with price action aiming lower, while the RSI records successive series of higher lows. Nevertheless, as the RSI already crossed its 50-midline, upwards and lately downwards, the uptrend is in question, but unless sellers break below the August 11 low at 0.9370, the major might remain range-bound.

The USD/CHF first resistance will be the R1 daily pivot at 0.9447. Break above could pave the way towards 0.9500. On the flip side, if the pair breaks below 0.9400, it could dip towards 0.9370.

USD/CHF Hourly chart

USDCHF Key Technical Levels


Overview
Today last price0.9418
Today Daily Change0.0006
Today Daily Change %0.06
Today daily open0.9411
 
Trends
Daily SMA200.9598
Daily SMA500.9671
Daily SMA1000.9632
Daily SMA2000.9431
 
Levels
Previous Daily High0.9446
Previous Daily Low0.9371
Previous Weekly High0.9652
Previous Weekly Low0.9471
Previous Monthly High0.9886
Previous Monthly Low0.9502
Daily Fibonacci 38.2%0.94
Daily Fibonacci 61.8%0.9417
Daily Pivot Point S10.9372
Daily Pivot Point S20.9334
Daily Pivot Point S30.9297
Daily Pivot Point R10.9448
Daily Pivot Point R20.9485
Daily Pivot Point R30.9524

Author

Christian Borjon Valencia

Christian Borjon began his career as a retail trader in 2010, mainly focused on technical analysis and strategies around it. He started as a swing trader, as he used to work in another industry unrelated to the financial markets.

More from Christian Borjon Valencia
Share:

Markets move fast. We move first.

Orange Juice Newsletter brings you expert driven insights - not headlines. Every day on your inbox.

By subscribing you agree to our Terms and conditions.

Editor's Picks

EUR/USD consolidates below 1.1700 amid cautious markets

EUR/USD is holding steady below 1.1700 in the European trading hours on Thursday. The pair pauses its losing streak as the US Dollar consolidates the recent recovery amid a cautious market mood and ahead of the mid-tier US employment data. 

GBP/USD turns lower to near 1.3450 amid softer risk tone

GBP/USD loses ground to trade near 1.3450 in the early European session on Thursday. Markets turn cautious amid simmering geopolitical tensions and ahead of the US labor market data due later in the day. 

Gold sticks to intraday losses below $4,450; seems vulnerable to slide further

Gold maintains its offered tone through the first half of the European session and currently trades near the lower end of its daily range, down for the second straight day. The downfall lacks any obvious fundamental catalyst and could be attributed to some follow-through profit-taking ahead of the release of the US Nonfarm Payrolls report on Friday. 

Pi Network flashes bearish potential as selling pressure mounts

Pi Network trades above $0.2000 at press time on Thursday, following a nearly 2% decline the previous day. Centralized Exchanges have received 1.90 million PI tokens over the last 24 hours, suggesting risk-off sentiment among holders. The technical outlook for the PI token remains bearish, with a risk of a cross below the 20-day Exponential Moving Average. 

2026 economic outlook: Clear skies but don’t unfasten your seatbelts yet

Most years fade into the background as soon as a new one starts. Not 2025: a year of epochal shifts, in which the macroeconomy was the dog that did not bark. What to expect in 2026? The shocks of 2025 will not be undone, but neither will they be repeated.

Pi Network Price Forecast: PI flashes bearish potential as selling pressure mounts

Pi Network trades above $0.2000 at press time on Thursday, following a nearly 2% decline the previous day. Centralized Exchanges have received 1.90 million PI tokens over the last 24 hours, suggesting risk-off sentiment among holders.