|

USD/CHF Price Analysis: Pressured below the 50-DMA, hovers around 0.9670s

  • The Swiss franc is registering decent gains of 0.20%, as shown by the USD/CHF falling.
  • A double top in the USD/CHF daily chart looms, targeting 0.9035.
  • USD/CHF Price Forecast: Range bound unless the USD/CHF breaks above-below the 0.9620-0.9700 area.

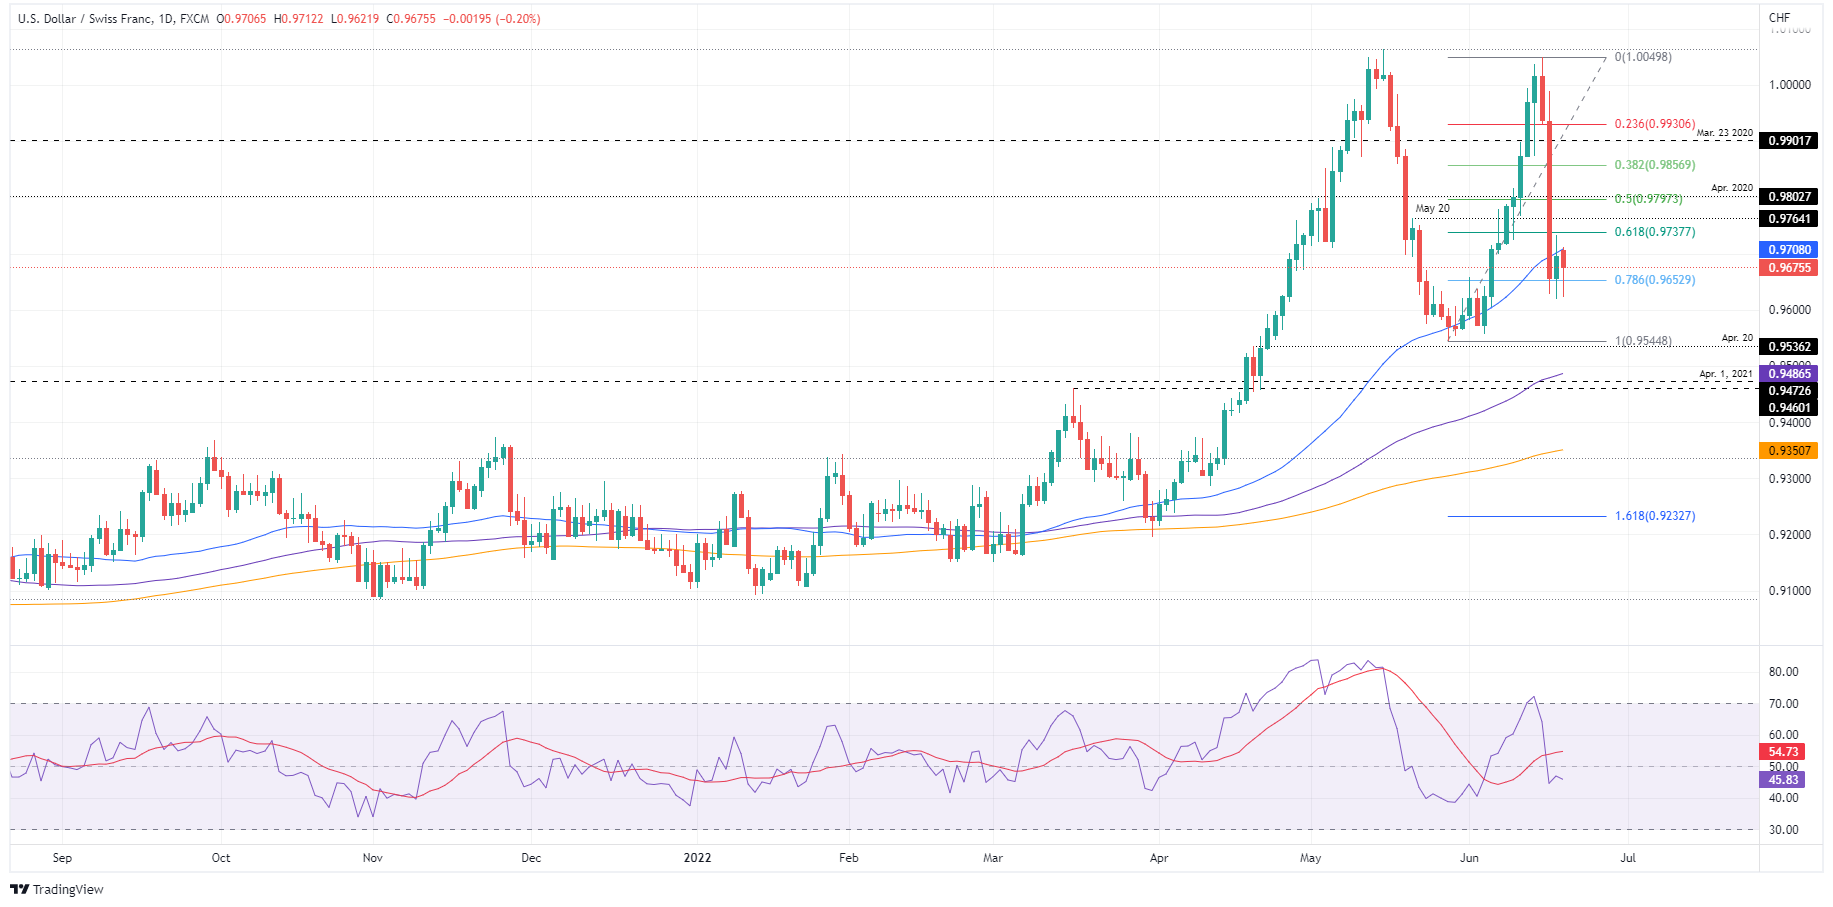
USD/CHF is retracing from the 50-day moving average (DMA) and last Friday’s high at 0.9708, down towards the 0.9670s, courtesy of a risk-on impulse as shown by European equities closing in the green, while US futures are trading with decent gains. At the time of writing, the USD/CHF is trading at 0.9675.

From a technical perspective, the USD/CHF is still headed upwards, despite being below the 50-DMA. The 100 and 200-DMA’s reside well below the spot price, but the double top looming on the daily chart looms, and once USD/CHF sellers achieve a daily close below 0.9544, that would open the door for further losses.

Nevertheless, mixed signals in the daily chart suggest caution is warranted. Also, it’s worth noting that, albeit the US Fed is on an “aggressive” tightening cycle, the Swiss National Bank (SNB) surprised the markets, hiking 50 bps its interest rates. Nonetheless, the US – Switzerland interest rates differential stills favor the greenback, with the US interest rates at 1.75%, while rates in Switzerland remain negative at -0.25%.

USD/CHF Price Forecast: Technical outlook

The USD/CHF is upward biased. The USD/CHF price action in the last two days shows that buyers are defending the 0.9620s-0.9650s area, with the USD/CHF registering daily closes around that area. Traders should keep in mind that the 78.6% Fibonacci retracement so far has kept sellers aside, and if USD/CHF buyers achieve a daily close above 0.9700, that will expand the consolidation area to the 0.9620-0.9700 region.

If USD/CHF buyers break above 0.9700, that will expose the 61.8% Fibonacci level at 0.9737, followed by the 50% Fibonacci retracement at 0.9797. Once cleared, a move towards 0.9800 is on the cards. On the other hand, the USD/CHF first support would be the 78.6% Fibonacci level at 0.9652. A breach of the latter would expose the June 17 low at 0.96119, followed by the 0.9600 figure.

Key Technical Levels

USD/CHF

Overview
Today last price0.9678
Today Daily Change-0.0027
Today Daily Change %-0.28
Today daily open0.9705
 
Trends
Daily SMA200.9713
Daily SMA500.9705
Daily SMA1000.9486
Daily SMA2000.9352
 
Levels
Previous Daily High0.9733
Previous Daily Low0.9619
Previous Weekly High1.005
Previous Weekly Low0.9619
Previous Monthly High1.0064
Previous Monthly Low0.9545
Daily Fibonacci 38.2%0.9689
Daily Fibonacci 61.8%0.9663
Daily Pivot Point S10.9638
Daily Pivot Point S20.9572
Daily Pivot Point S30.9525
Daily Pivot Point R10.9752
Daily Pivot Point R20.9799
Daily Pivot Point R30.9865

Author

Christian Borjon Valencia

Markets analyst, news editor, and trading instructor with over 14 years of experience across FX, commodities, US equity indices, and global macro markets.

More from Christian Borjon Valencia
Share:

Editor's Picks

AUD/USD falls to near 0.7100 after slipping below 50-day EMA

AUD/USD depreciates after registering minor gains in the previous day, trading around 0.7120 during the Asian hours. The technical analysis of the daily chart shows the pair consolidating sideways within a rectangle pattern, as neither bulls nor bears gain control. The AUD/USD pair is holding a slight bearish tone however as it sits beneath both the nine-day and 50-day EMAs.

160.00: USD/JPY back near intervention territory after upbeat US jobs report

US Nonfarm Payrolls beat expectations by a wide margin in May, with 172K jobs added. The US Dollar rebounds after the release, helping USD/JPY recover from its intraday lows. Warnings from Japanese authorities continue to limit upside potential near the 160.00 threshold.

Gold targets $4,300 amid stronger Dollar

Gold faces increasing selling interest and navigates the area of three-month lows near the $4,300 mark per troy ounce on Friday. The precious metal’s decline comes as traders assess the stronger-than-expected NFP, while the bid bias in the Greenback and higher US Treasury yields also collaborate with the retracement.

Cardano hits five-year low even as Hoskinson clarifies "break" isn't an exit

Cardano (ADA) price is down 10% at press time on Friday, extending losses over 30% so far this week amid Charles Hoskinson's clarification that "break" isn't an exit.

Week ahead – Fed countdown begins amid US inflation data and geopolitical risks

Fed Chair Warsh’s first meeting approaches as key US inflation data could reshape expectations. Oil prices remain elevated as US-Iran talks continue; tariffs also return to the spotlight. ECB is expected to hike; will it be a one-off move or is July live?

The US economy defies the rules: 100 days into the Oil shock and the recession signal is still missing

More than three months after the start of the Iran war and the resulting disruption to global energy markets, the US economy continues to display remarkable resilience. The conflict has triggered a sharp rise in Oil prices, reignited inflationary pressures and fueled widespread concerns about a potential economic slowdown.