|

USD/CHF Price Analysis: Plummets to two-year lows, below 0.8800

  • USD/CHF eyes 2021 low at 0.8757 after the pair slid past the prior’s YTD low of 0.8819.
  • RSI and RoC give mixed signals, warranting USD/CHF traders from opening fresh positions ahead of US CPI data
  • Immediate resistance lies at the 0.8800 mark, while support lies at 0.8757.

USD/CHF plunges to new two-year lows as the greenback falls sharply ahead of the release of the Consumer Price Index (CPI) in the United States (US). At the time of writing, the USD/CHF is trading at 0.8799, down 1.04%, after hitting a high of 0.8918.

USD/CHF Price Analysis: Technical outlook

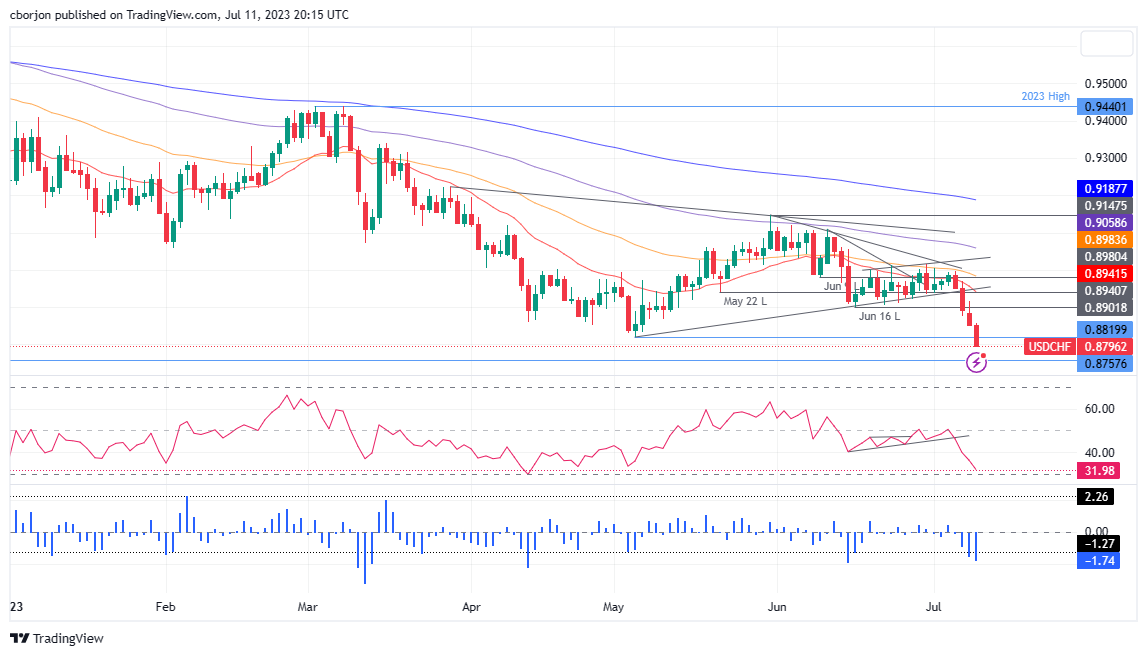
The USD/CHF remains downward biased and set to extend its losses to fresh multi-year lows, with the 2021 yearly low in sight at 0.8757. Notably, the USD/CHF peaked just below the 0.9000 figure, which capped the pair’s rallies since April 2023.

As the USD/CHF continues to trend lower, below 0.8800, the next support emerged at 0.8757. A breach of the latter will expose the 0.8750, followed by the 0.8700. As the pair edged lower, a divergence between the USD/CHF price action printing lower lows, the three-day Rate of Change (RoC) shows sellers are losing some momentum. Nevertheless, mixed signals between the latter and the Relative Strength Index (RSI), depicting sellers remain in charge, could refrain traders from opening fresh shorts before releasing crucial US economic data.

Contrarily, the USD/CHF first resistance would emerge at the 0.8800 mark. Once cleared, the USD/CHF could reach the June 16 swing low-turned resistance at 0.8902 before challenging the 20-day Exponential Moving Average (EMA) at 0.8942.

USD/CHF Price Action – Daily chart

USD/CHF Daily chart

USD/CHF

Overview
Today last price0.8797
Today Daily Change-0.0057
Today Daily Change %-0.64
Today daily open0.8854
 
Trends
Daily SMA200.8957
Daily SMA500.8982
Daily SMA1000.9067
Daily SMA2000.9277
 
Levels
Previous Daily High0.8918
Previous Daily Low0.8852
Previous Weekly High0.9005
Previous Weekly Low0.8876
Previous Monthly High0.912
Previous Monthly Low0.8902
Daily Fibonacci 38.2%0.8877
Daily Fibonacci 61.8%0.8893
Daily Pivot Point S10.8831
Daily Pivot Point S20.8809
Daily Pivot Point S30.8765
Daily Pivot Point R10.8897
Daily Pivot Point R20.8941
Daily Pivot Point R30.8963

Author

Christian Borjon Valencia

Markets analyst, news editor, and trading instructor with over 14 years of experience across FX, commodities, US equity indices, and global macro markets.

More from Christian Borjon Valencia
Share:

Editor's Picks

EUR/USD flirts with daily highs, retargets 1.1900

EUR/USD regains upside traction, returning to the 1.1880 zone and refocusing its attention to the key 1.1900 barrier. The pair’s slight gains comes against the backdrop of a humble decline in the US Dollar as investors continue to assess the latest US CPI readings and the potential Fed’s rate path.

GBP/USD remains well bid around 1.3650

GBP/USD maintains its upside momentum in place, hovering around daily highs near 1.3650 and setting aside part of the recent three-day drop. Cable’s improved sentiment comes on the back of the Greenback’s  irresolute price action, while recent hawkish comments from the BoE’s Pill also collaborate with the uptick.

Gold holds above $5,000 as bears seem hesitant amid Fed rate cut bets

Gold edges lower at the start of a new week, though it defends the $5,000 psychological mark through the Asian session. The underlying bullish sentiment is seen acting as a headwind for the bullion. However, bets for more rate cuts by the Fed, bolstered by Friday's softer US CPI, keep the US Dollar bulls on the defensive and continue to support the non-yielding yellow metal as the focus now shifts to FOMC Minutes on Wednesday.

Week ahead: Data blitz, Fed Minutes and RBNZ decision in the spotlight

The US jobs report for January, which was delayed slightly, didn’t do the dovish Fed bets any favours, as expectations of a soft print did not materialize, confounding the raft of weak job indicators seen in the prior week.

Global inflation watch: Signs of cooling services inflation

Realized inflation landed close to expectations in January, as negative base effects weighed on the annual rates. Remaining sticky inflation is largely explained by services, while tariff-driven goods inflation remains limited even in the US.

Ripple Price Forecast: XRP potential bottom could be in sight

Ripple edges up above the intraday low of $1.35 at the time of writing on Friday amid mixed price actions across the crypto market. The remittance token failed to hold support at $1.40 the previous day, reflecting risk-off sentiment amid a decline in retail and institutional sentiment.