|

USD/CHF Price Analysis: Holds to earlier gains but surrenders 0.9000, as the outlook turns neutral

  • USD/CHF trades below the weekly high, failing to conquer the 50-day EMA; currently trading at 0.8984, up 0.05%.
  • The technical outlook remains neutral unless the pair can reclaim the 50-day EMA at 0.9027 and the 100-day EMA at 0.9144.
  • RSI indicator suggests buyers are moving in, but key resistance levels lie ahead; downside risks emerge below the 20-day EMA.

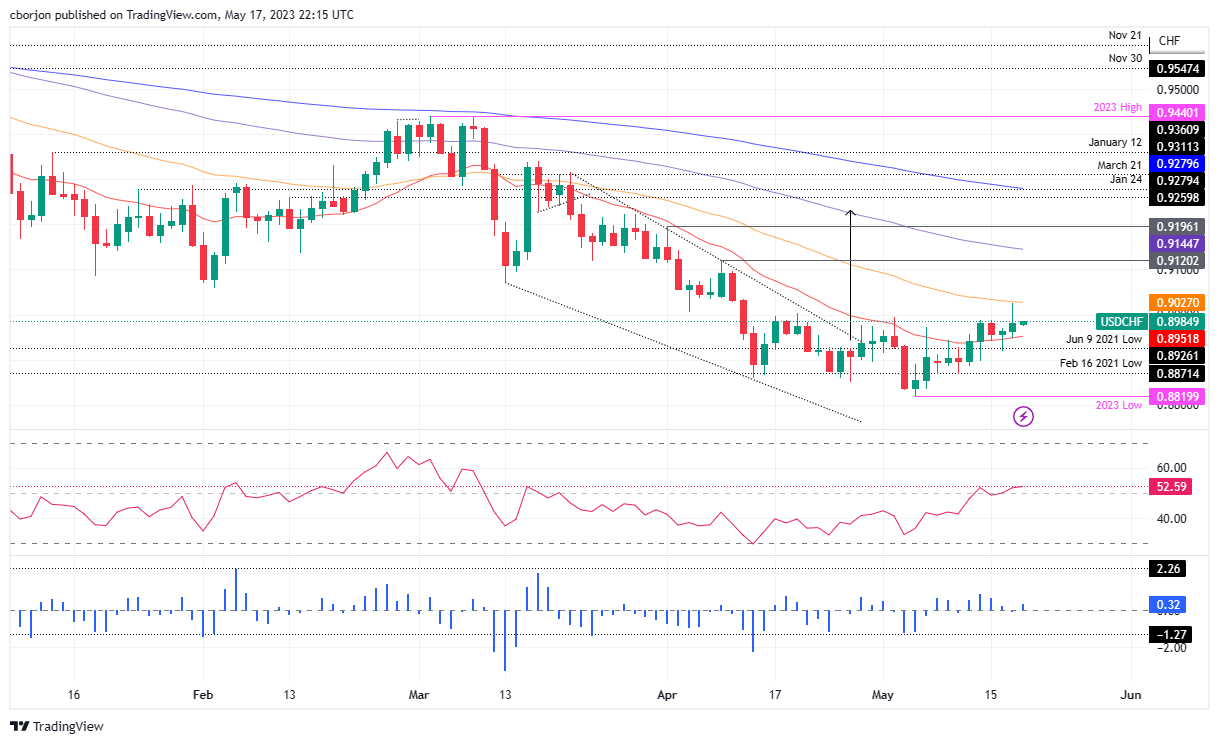
USD/CHF holds to its earlier gains achieved after three days of consecutive gains. However, it’s trading well below the weekly high, which tested the 50-day Exponential Moving Average (EMA) at 0.9027 but failed to conquer the latter. Hence, the USD/CHF retreated beneath the 0.9000 figure, and as the Asian session begins is trading at 0.8984, up 0.05%.

USD/CHF Price Analysis: Technical outlook

Wednesday’s price action formed an inverted hammer candlestick that fell shy of cracking the 50-day EMA, though it retreated and stood above the 20-day EMA at 0.8951. However, the USD/CHF bias remains neutrally biased unless buyers reclaim the 50-day EMA at 0.902, followed by the 100-day EMA at 0.9144.

The Relative Strength Index (RSI) indicator entered the bullish territory, suggesting buyers are moving in, while the 3-day Rate of Change (RoC) jumped above the neutral line.

Therefore, the path of least resistance is upward biased in the near term. The USD/CHF first resistance would be the 0.9000 figure, followed by the 50-day EMA at 0.9027. Once cleared, ad upside risks lie at 0.9120, the April 10 high, followed by the April 3 daily high of 0.9196.

Conversely, downside risks for the USD/CHF emerge below the 20-day EMA at 0.8951, followed by the psychological 0.8900 mark.

USD/CHF Price Action – Daily chart

USD/CHF Daily chart

USD/CHF

Overview
Today last price0.8983
Today Daily Change0.0017
Today Daily Change %0.19
Today daily open0.8966
 
Trends
Daily SMA200.8922
Daily SMA500.9053
Daily SMA1000.9158
Daily SMA2000.9409
 
Levels
Previous Daily High0.8971
Previous Daily Low0.892
Previous Weekly High0.8988
Previous Weekly Low0.8868
Previous Monthly High0.9198
Previous Monthly Low0.8852
Daily Fibonacci 38.2%0.8951
Daily Fibonacci 61.8%0.8939
Daily Pivot Point S10.8934
Daily Pivot Point S20.8902
Daily Pivot Point S30.8883
Daily Pivot Point R10.8985
Daily Pivot Point R20.9003
Daily Pivot Point R30.9035

Author

Christian Borjon Valencia

Christian Borjon began his career as a retail trader in 2010, mainly focused on technical analysis and strategies around it. He started as a swing trader, as he used to work in another industry unrelated to the financial markets.

More from Christian Borjon Valencia
Share:

Markets move fast. We move first.

Orange Juice Newsletter brings you expert driven insights - not headlines. Every day on your inbox.

By subscribing you agree to our Terms and conditions.

Editor's Picks

EUR/USD climbs toward 1.1800 on broad USD weakness

EUR/USD gathers bullish momentum and advances toward 1.1800 in the second half of the day on Tuesday. The US Dollar weakens and helps the pair stretch higher after the employment report showed that Nonfarm Payrolls declined by 105,000 in October before rising by 64,000 in November.

GBP/USD climbs to fresh two-month high above 1.3400

GBP/USD gains traction in the American session and trades at its highest level since mid-October above 1.3430. The British Pound benefits from upbeat PMI data, while the US Dollar struggles to find demand following the mixed employment figures and weaker-than-forecast PMI prints, allowing the pair to march north.

Gold extends its consolidative phase around $4,300

Gold trades in positive above $4,300 after spending the first half of the day under bearish pressure. XAU/USD capitalizes on renewed USD weakness after the jobs report showed that the Unemployment Rate climbed to 4.6% in November and the PMI data revealed a loss of growth momentum in the private sector in December. 

XRP dips as bearish pressure persists despite ETF growth

Ripple is finding footing above $1.90 at the time of writing on Tuesday after a bearish wave swept across the broader cryptocurrency market, building on persistent negative sentiment.

Ukraine-Russia in the spotlight once again

Since the start of the week, gold’s price has moved lower, but has yet to erase the gains made last week. In today’s report we intend to focus on the newest round of peace talks between Russia and Ukraine, whilst noting the release of the US Employment data later on day and end our report with an update in regards to the tensions brewing in Venezuela.

BNB Price Forecast: BNB slips below $855 as bearish on-chain signals and momentum indicators turn negative

BNB, formerly known as Binance Coin, continues to trade down around $855 at the time of writing on Tuesday, after a slight decline the previous day. Bearish sentiment further strengthens as BNB’s on-chain and derivatives data show rising retail activity.