|

USD/CHF Price Analysis: Hits new YTD lows for the second consecutive day at around 0.8850s

  • USD/CHF is poised for further decline on the daily chart.
  • USD/CHF 4-Hour chart suggests consolidation, but a bearish continuation could happen below 0.8859.
  • Bearish oscillators with oversold RSI may lead to an upward correction.

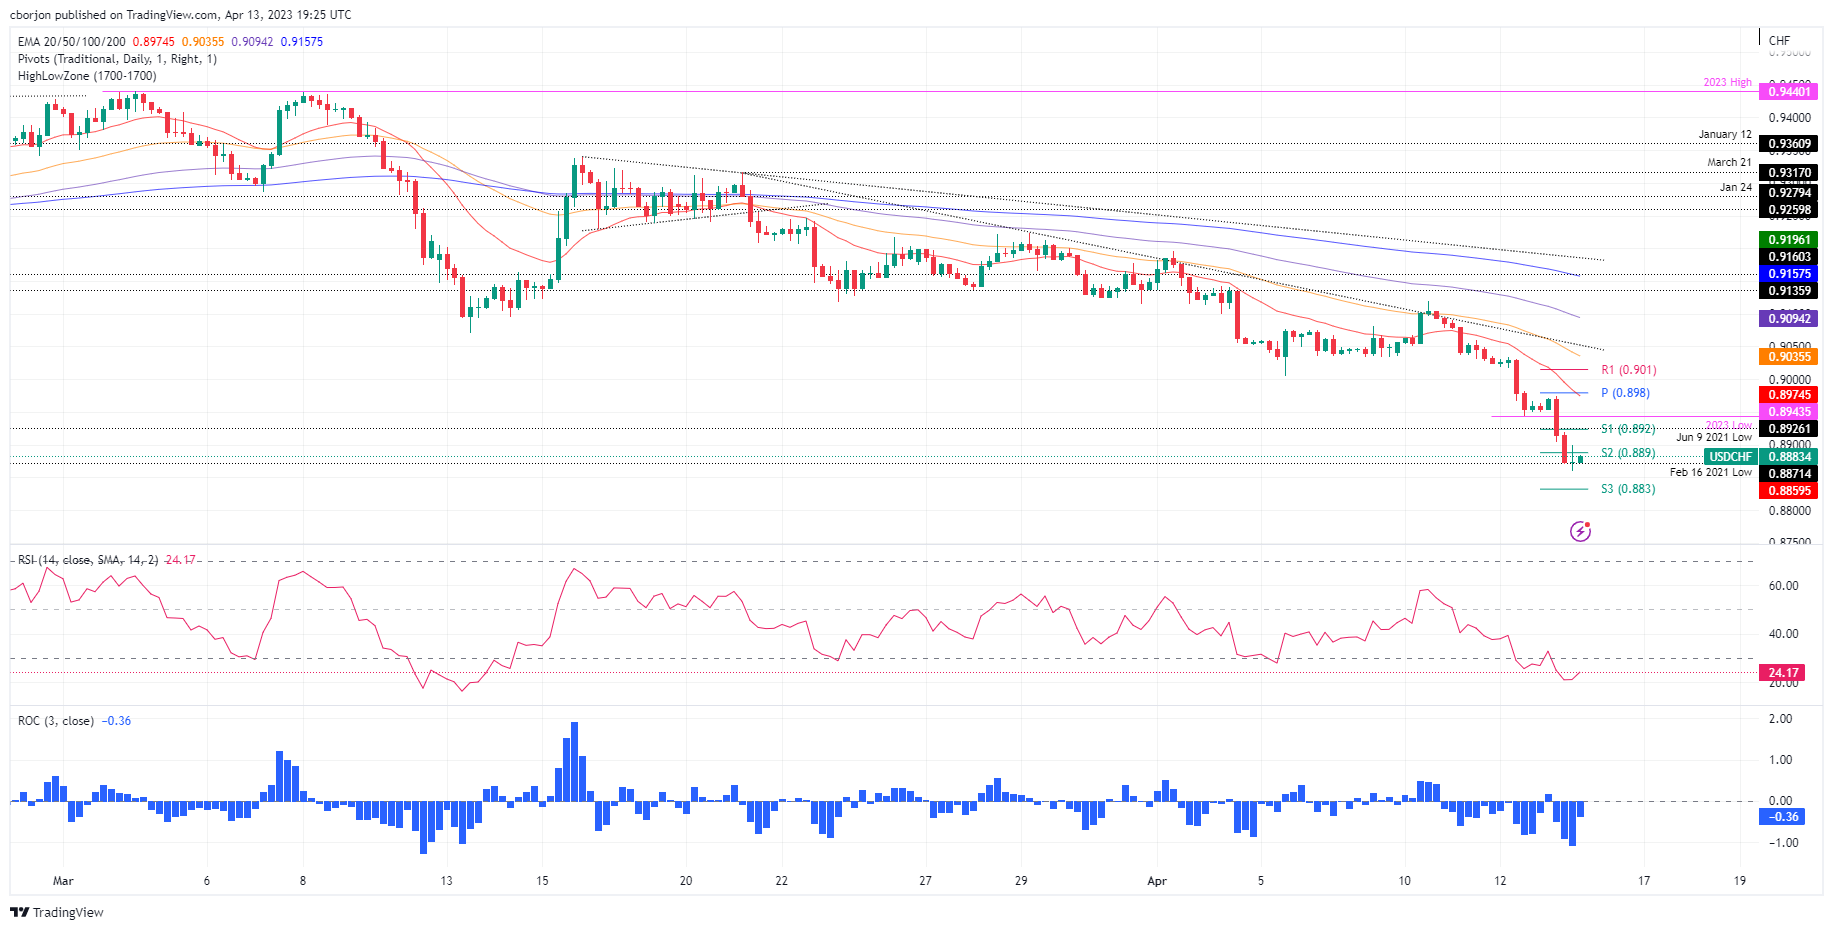
USD/CHF extended to new year-to-date (YTD) lows for the second straight day at 0.8859, though it rebounded slightly but remained below the psychological resistance at 0.8900. Fundamentals pointing the US economy toward a strong deceleration and a possible US Federal Reserve (Fed) pivot are the main reasons pressuring the American Dollar (USD). Therefore, the USD/CHF is trading at 0.8882 after hitting a high of 0.8974.

USD/CHF Price Action

From a daily chart perspective, the USD/CHF might continue to fall further, though buyers stepped in at around 0.8871, the February 16 cycle low. Although the USD/CHF fell beyond the latter, it bounced strongly, as USD/CHF bulls look forward to reclaiming the 0.8900 figure.

Short term, the USD/CHF 4-Hour chart suggests the pair is consolidating once it formed a doji, just below the S2 daily pivot point around 0.8888. For a bearish continuation, the USD/CHF needs to dive below 0.8859 to extend its losses toward the S3 pivot point at 0.8832, ahead of falling to 0.8800.

Although oscillators like the Relative Strength Index (RSI) and the Rate of Change (RoC) maintain a bearish bias, the RSI is in oversold territory. Hence, an upward correction is likely, though buyers must reclaim the 0.8900 figure.

Once achieved, the USD/CHF next resistance would bet the S1 pivot point at 0.8925, followed by the confluence of the daily pivot point and the 20-day EMA at 0.8975/80 before testing 0.9000.

USD/CHF 4-Hour chart

USD/CHF 4-hour chart

USD/CHF Technical Levels

USD/CHF

Overview
Today last price0.8882
Today Daily Change-0.0079
Today Daily Change %-0.88
Today daily open0.8961
 
Trends
Daily SMA200.9143
Daily SMA500.9228
Daily SMA1000.9263
Daily SMA2000.9497
 
Levels
Previous Daily High0.9039
Previous Daily Low0.8944
Previous Weekly High0.9198
Previous Weekly Low0.9007
Previous Monthly High0.944
Previous Monthly Low0.9072
Daily Fibonacci 38.2%0.898
Daily Fibonacci 61.8%0.9002
Daily Pivot Point S10.8924
Daily Pivot Point S20.8886
Daily Pivot Point S30.8828
Daily Pivot Point R10.9018
Daily Pivot Point R20.9076
Daily Pivot Point R30.9113

Author

Christian Borjon Valencia

Markets analyst, news editor, and trading instructor with over 14 years of experience across FX, commodities, US equity indices, and global macro markets.

More from Christian Borjon Valencia
Share:

Editor's Picks

EUR/USD holds gains around 1.1800 amid renewed USD selling

EUR/USD regains positive traction and holds around 1.1800 in the European session, reversing the previous day's modest losses. The pair's uptick is sponsored by the emergence of fresh US Dollar selling, which remains induced by persistent trade-related uncertainties. 

GBP/USD strengthens above 1.3500 on softer US Dollar

GBP/USD is posting moderate gains above 1.3500 in European trading on Wednesday. The pair appreciates as the US Dollar meets fresh supply following US President Donald Trump’s first State of the Union address and amid looming tariff uncertainty. 

Gold eyes monthly top above $5,200 amid geopolitics, trade jitters

Gold buyers are back in the game, eyeing $5,200 and beyonf on Wednesday after seeing a correction from monthly highs on Tuesday. The US Dollar slips after Trump’s SOTU fails to impress and as AI-driven worries ease. Dovish Fed bets also weigh.  Gold looks north so long as the key 61.8% Fibo resistance at $5,142 holds on the daily chart.

Bitcoin, Ethereum and Ripple post cautious recovery amid downside risks

Bitcoin, Ethereum, and Ripple are posting a cautious recovery on Wednesday following a market correction earlier this week.  BTC is approaching a key breakdown level, while ETH and XRP are rebounding from crucial support levels.

Nvidia remains at the heart of the AI boom

Nvidia remains at the heart of the AI boom, with Q4 revenue projected near $65.6–66.1 billion, nearly 70% higher year-over-year. But investors are watching cash flow, leverage, and broader AI adoption. Growth is strong, but the AI stress isn’t over.

Cosmos Hub Price Forecast: ATOM rebounds slightly, bearish outlook remains intact

Cosmos Hub (ATOM) price rebounds, trading above $2.05 at the time of writing on Wednesday, after undergoing a sharp correction since last week. Weakening on-chain and derivatives data support a bearish outlook, while technical analysis remains unfavorable.