|

USD/CHF Price Analysis: Firm at around 0.8950, eyeing EMA resistance level as bulls eye 0.9000

  • USD/CHF hovers near 0.8950 and eyes 20-day and 50-day EMA resistance at 0.8988 and 0.9014.
  • RSI nearing 50 midlines, suggesting potential bullish movement.
  • Bearish continuation requires a break below 0.8900, revealing a YTD low of 0.8820.

USD/CHF trims some of its last Friday’s gains thought remains firm nearby 0.8950s after bouncing from daily lows reached early in the European session at around 0.8911. At the time of writing, the USD/CHF exchanges hands at 0.8952, down 0.17%, after failing to crack under the 0.8900 mark.

USD/CHF Price Analysis: Technical outlook

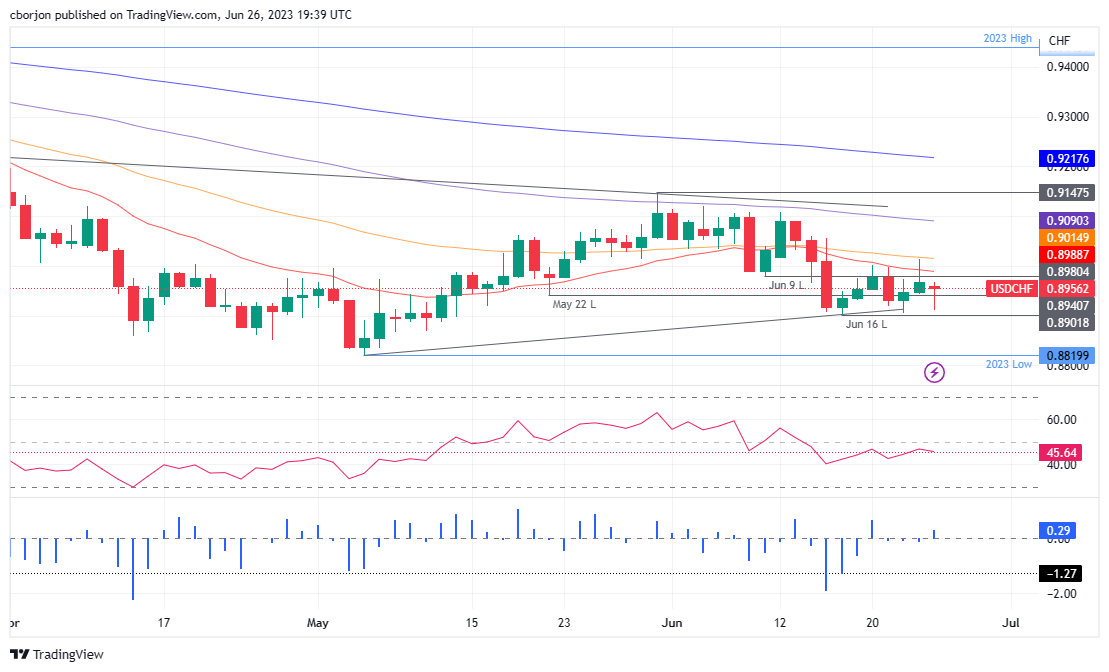
From a daily chart perspective, the USD/CHF remains neutral to downward biased but at the brisk of surpassing resistance levels like the 20 and 50-day Exponential Moving Averages (EMAs) at 0.8988 and 0.9014, respectively. Of note, the Relative Strength Index (RSI) indicator is closing into the 50-midline, which, once crossed, would trigger a buy signal. The three-day Rate of Change (RoC) depicts that buyers moved into the 0.8900 figure, as it prints its biggest gain, snapping three days of negative readings.

Therefore, the USD/CHF firsT resistance would be the 20-day EMA, followed by the 0.9000 figure. Break above will expose the 50-day EMA, followed by the 100-day EMA at 0.9090, ahead of 0.9100. On the flip side, the USD/CHF must break below 0.8900 for a bearish continuation, exposing the year-to-date (YTD) low of 0.8820, ahead of 0.8800.

USD/CHF Price Action – Daily chart

USD/CHF Daily chart

USD/CHF

Overview
Today last price0.8956
Today Daily Change-0.0018
Today Daily Change %-0.20
Today daily open0.8974
 
Trends
Daily SMA200.9021
Daily SMA500.898
Daily SMA1000.9098
Daily SMA2000.9323
 
Levels
Previous Daily High0.9013
Previous Daily Low0.8944
Previous Weekly High0.9013
Previous Weekly Low0.8907
Previous Monthly High0.9148
Previous Monthly Low0.882
Daily Fibonacci 38.2%0.8987
Daily Fibonacci 61.8%0.8971
Daily Pivot Point S10.8941
Daily Pivot Point S20.8908
Daily Pivot Point S30.8872
Daily Pivot Point R10.901
Daily Pivot Point R20.9046
Daily Pivot Point R30.9078

Author

Christian Borjon Valencia

Markets analyst, news editor, and trading instructor with over 14 years of experience across FX, commodities, US equity indices, and global macro markets.

More from Christian Borjon Valencia
Share:

Editor's Picks

EUR/USD flirts with daily highs, retargets 1.1900

EUR/USD regains upside traction, returning to the 1.1880 zone and refocusing its attention to the key 1.1900 barrier. The pair’s slight gains comes against the backdrop of a humble decline in the US Dollar as investors continue to assess the latest US CPI readings and the potential Fed’s rate path.

GBP/USD remains well bid around 1.3650

GBP/USD maintains its upside momentum in place, hovering around daily highs near 1.3650 and setting aside part of the recent three-day drop. Cable’s improved sentiment comes on the back of the Greenback’s  irresolute price action, while recent hawkish comments from the BoE’s Pill also collaborate with the uptick.

Gold clings to gains just above $5,000/oz

Gold is reclaiming part of the ground lost on Wednesday’s marked decline, as bargain-hunters keep piling up and lifting prices past the key $5,000 per troy ounce. The precious metal’s move higher is also underpinned by the slight pullback in the US Dollar and declining US Treasury yields across the curve.

Crypto Today: Bitcoin, Ethereum, XRP in choppy price action, weighed down by falling institutional interest 

Bitcoin's upside remains largely constrained amid weak technicals and declining institutional interest. Ethereum trades sideways above $1,900 support with the upside capped below $2,000 amid ETF outflows.

Week ahead – Data blitz, Fed Minutes and RBNZ decision in the spotlight

US GDP and PCE inflation are main highlights, plus the Fed minutes. UK and Japan have busy calendars too with focus on CPI. Flash PMIs for February will also be doing the rounds. RBNZ meets, is unlikely to follow RBA’s hawkish path.

Ripple Price Forecast: XRP potential bottom could be in sight

Ripple edges up above the intraday low of $1.35 at the time of writing on Friday amid mixed price actions across the crypto market. The remittance token failed to hold support at $1.40 the previous day, reflecting risk-off sentiment amid a decline in retail and institutional sentiment.