|

USD/CHF Price Analysis: Finished the week positive, though fell beneath 0.9270s

  • Albeit the USD/CHF fell 1% on Friday, the pair finished the week with gains of 0.45%.
  • USD/CHF remains sideways, though slightly tilted downwards, and it could test the 0.9200 mark.
  • If the USD/CHF reclaims 0.9300, that could pave the way to 0.9400.

The USD/CHF plunged after hitting fresh weekly highs around 0.9408, plummeting beneath the 0.9300 figure, on mixed US economic data that triggered a sell-off in the US Dollar (USD); therefore, the USD/CHF collapsed. At the time of writing, the USD/CHF is trading at 0.9281.

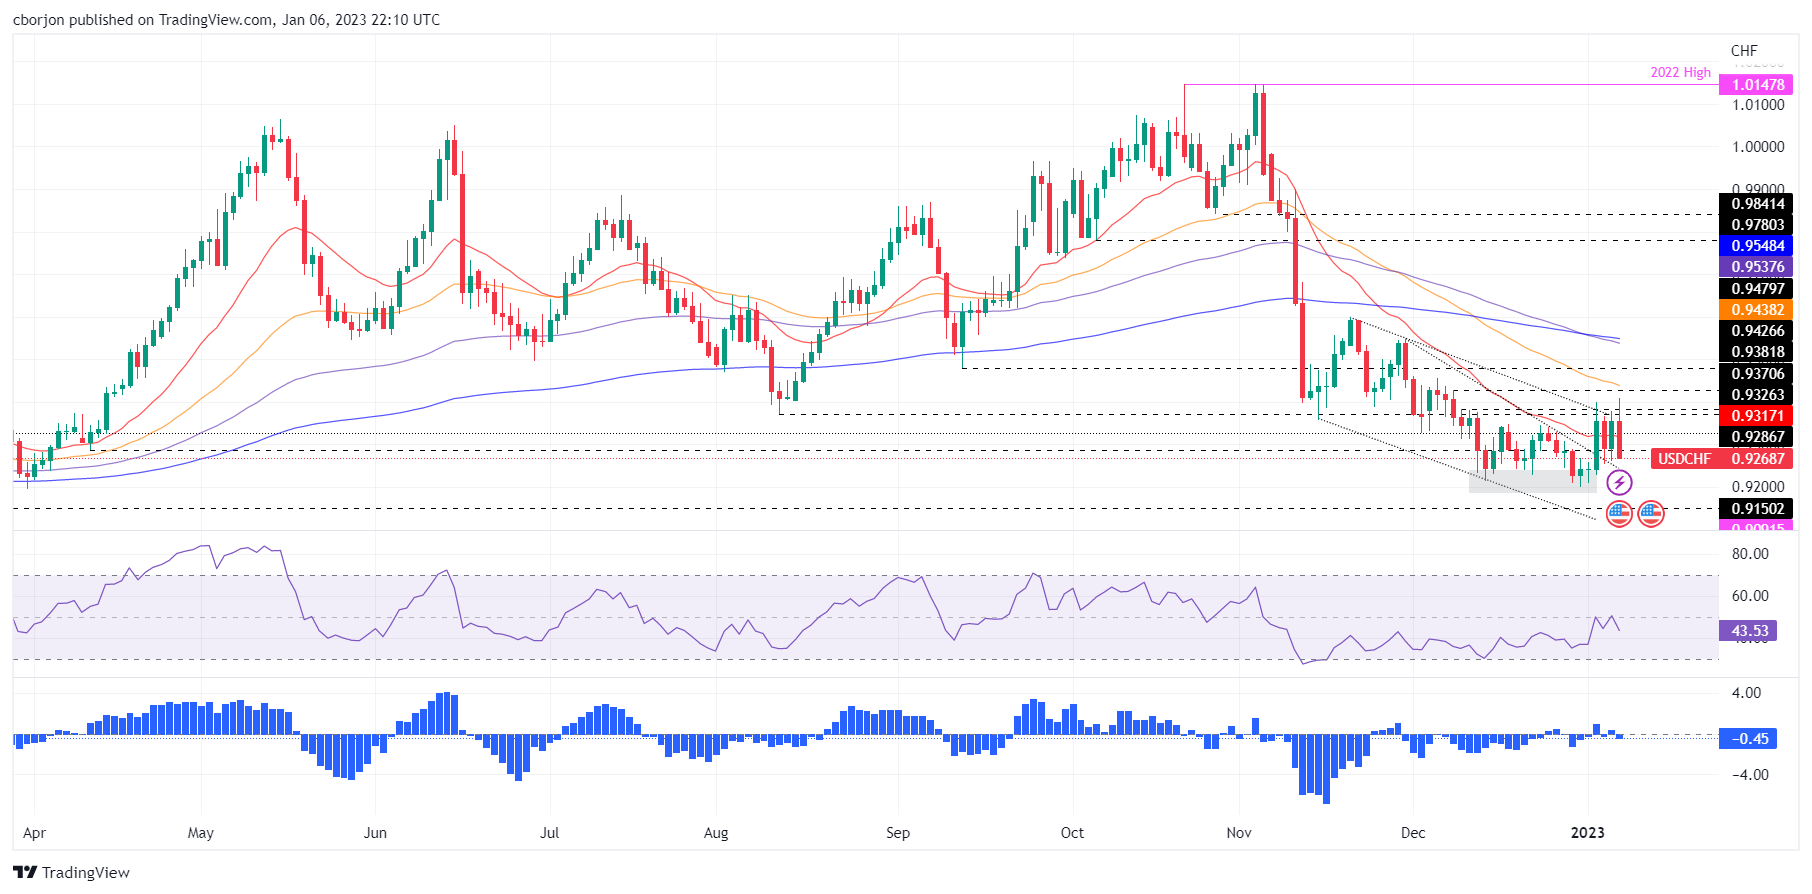
USD/CHF Price Analysis: Technical outlook

From a weekly chart perspective, after hitting a weekly high of around 0.9408, the USD/CHF finished the week with gains of 0.45%. It should be said that the week ending on January 6 printed a candlestick with a significant upper wick, meaning that sellers are gathering momentum. With the Relative Strength Index (RSI) extending its fall to bearish territory and the Rate of Change (RoC) aiming lower, the USD/CHF could test 0.9200 in the near term.

The USD/CHF daily chart portrays the pair as downward biased, though consolidating and unable to crack the 0,9200 mark. Following the upbreak of a falling wedge, the USD/CHF failed to gain traction and got trapped around the 0.9250-0.9400 mark.

Oscillators like the Relative Strength Index (RSI) shifted gears, turning bearish, while the Rate of Change (RoC) suggests that sellers outpaced buyers.

Therefore, the USD/CHF first support would be the falling wedge top-trendline which turned support at 0.9240, followed by the 0.9200 mark. Break below, and the USD/CHF might fall toward the 2022 low of 0.9091. On the flip side, the USD/CHF first resistance would be the 0.9300 mark. Once cleared, the next resistance would be January’s 6 high of 0.9408, followed by the 50-day Exponential Moving Average (EMA) at 0.9438.

USD/CHF Key Technical Levels

USD/CHF

Overview
Today last price0.9277
Today Daily Change-0.0089
Today Daily Change %-0.95
Today daily open0.9366
 
Trends
Daily SMA200.9301
Daily SMA500.9488
Daily SMA1000.9647
Daily SMA2000.9645
 
Levels
Previous Daily High0.9378
Previous Daily Low0.9261
Previous Weekly High0.9338
Previous Weekly Low0.9201
Previous Monthly High0.9471
Previous Monthly Low0.9201
Daily Fibonacci 38.2%0.9333
Daily Fibonacci 61.8%0.9306
Daily Pivot Point S10.9292
Daily Pivot Point S20.9217
Daily Pivot Point S30.9174
Daily Pivot Point R10.9409
Daily Pivot Point R20.9452
Daily Pivot Point R30.9526

Author

Christian Borjon Valencia

Christian Borjon began his career as a retail trader in 2010, mainly focused on technical analysis and strategies around it. He started as a swing trader, as he used to work in another industry unrelated to the financial markets.

More from Christian Borjon Valencia
Share:

Markets move fast. We move first.

Orange Juice Newsletter brings you expert driven insights - not headlines. Every day on your inbox.

By subscribing you agree to our Terms and conditions.

Editor's Picks

EUR/USD drops to daily lows near 1.1630

EUR/USD now loses some traction and slips back to the area of daily lows around 1.1630 on the back of a mild bounce in the US Dollar. Fresh US data, including the September PCE inflation numbers and the latest read on December consumer sentiment, didn’t really move the needle, so the pair is still on course to finish the week with a respectable gain.

GBP/USD trims gains, recedes toward 1.3320

GBP/USD is struggling to keep its daily advance, coming under fresh pressure and retreating to the 1.3320 zone following a mild bullish attempt in the Greenback. Even though US consumer sentiment surprised to the upside, the US Dollar isn’t getting much love, as traders are far more interested in what the Fed will say next week.

Gold makes a U-turn, back to $4,200

Gold is now losing the grip and receding to the key $4,200 region per troy ounce following some signs of life in the Greenback and a marked bounce in US Treasury yields across the board. The positive outlook for the precious metal, however, remains underpinned by steady bets for extra easing by the Fed.

Crypto Today: Bitcoin, Ethereum, XRP pare gains despite increasing hopes of upcoming Fed rate cut

Bitcoin is steadying above $91,000 at the time of writing on Friday. Ethereum remains above $3,100, reflecting positive sentiment ahead of the Federal Reserve's (Fed) monetary policy meeting on December 10.

Week ahead – Rate cut or market shock? The Fed decides

Fed rate cut widely expected; dot plot and overall meeting rhetoric also matter. Risk appetite is supported by Fed rate cut expectations; cryptos show signs of life. RBA, BoC and SNB also meet; chances of surprises are relatively low.

Ripple faces persistent bear risks, shrugging off ETF inflows

Ripple is extending its decline for the second consecutive day, trading at $2.06 at the time of writing on Friday. Sentiment surrounding the cross-border remittance token continues to lag despite steady inflows into XRP spot ETFs.