USD/CHF Price Analysis: Finds support below 200-DEMA despite likely SNB’s intervention
- USD/CHF gains ground near 0.8900 as the USD Index holds key support of 104.00.
- Weak US ADP Employment has limited the US Dollar’s upside.
- The SNB is expected to intervene amid fears that the weak Swiss Franc could revamp inflation again.

The USD/CHF pair finds cushion near the round-level support of 0.8900 in Wednesday’s New York session. The Swiss Franc asset finds support even though there is a firm speculation that the Swiss National Bank (SNB) will intervene in currency markets to support the Swiss Franc.
The Swiss Franc is up 3.6% against the US Dollar from May 1 but is overall down 6%, which has made Swiss exports competitive globally. This could feed inflationary pressures and push the annual Consumer Price Index (CPI) back above the 2% threshold.
Meanwhile, the US Dollar Index (DXY) retreated from 104.30 after the release of the weaker-than-expected United States (US) Automatic Data Processing (ADP) Employment data for May but holds the crucial support of 104.00. The agency reported that private employers hired 152K job-seekers, which was lower than estimates of 173K and the former release of 188K. This has deepened fears of easing labor market strength. Earlier, the USD rebounded from 104.00
This week, the major event for the US Dollar will be the US Nonfarm payrolls (NFP) report for May, which will be published on Friday. The NFP report will significantly influence market speculation for the Federal Reserve (Fed) reducing interest rates from the September meeting.
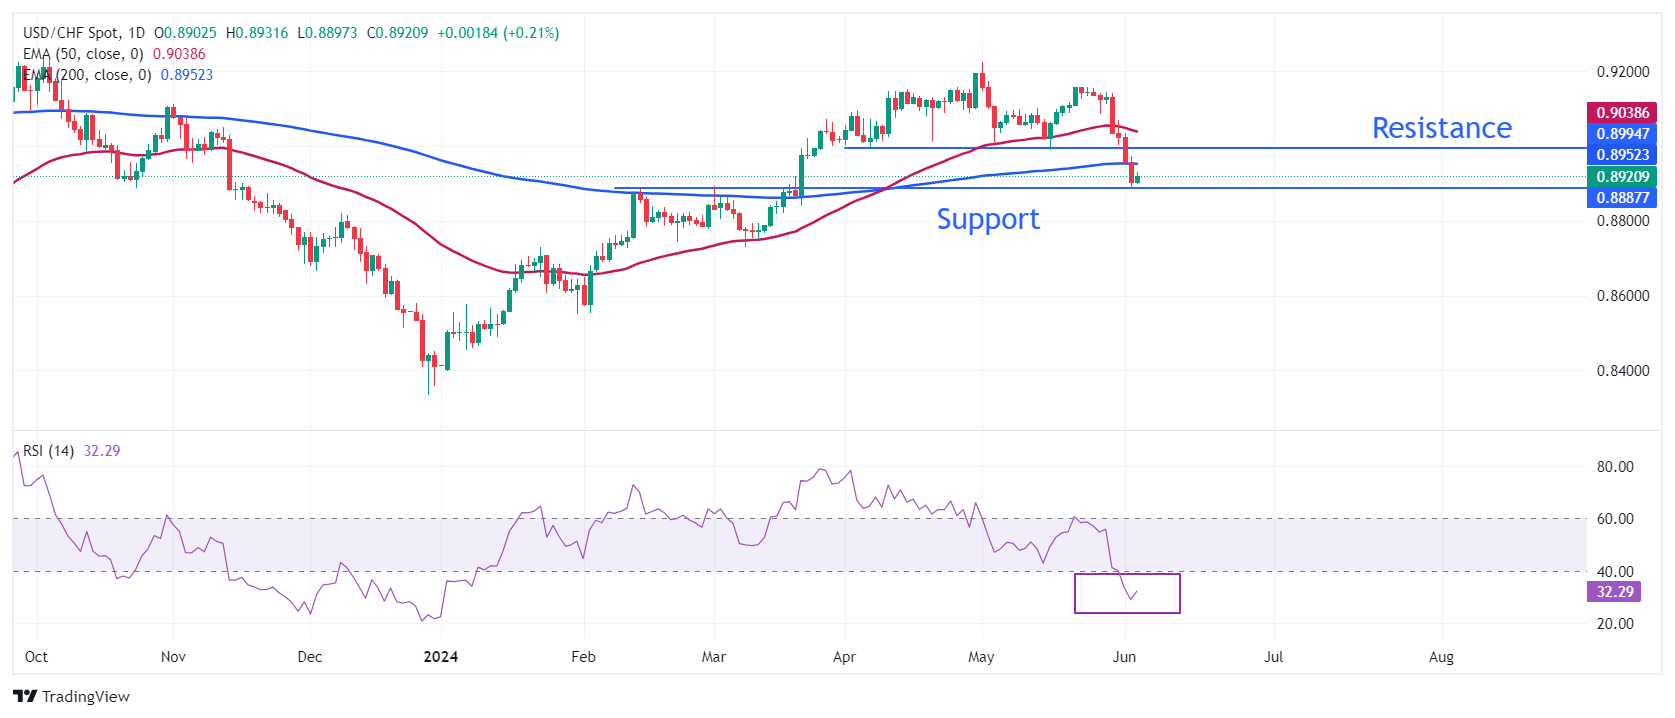
USD/CHF discovers buying interest near the horizontal support plotted from February 14 high at 0.8886. Earlier, the Swiss Franc asset weakened after breaking below the horizontal support marked from April 5 near 0.9000, which has become a major resistance for the US Dollar bulls.
The overall trend is bearish as the major stays below the 50- and 200-day Exponential Moving Averages (EMAs), which trade around 0.9038 and 0.8590, respectively.
The 14-period Relative Strength Index (RSI) shifts into the bearish range of 20.00-40.00, indicating that momentum has leaned towards the downside.
Fresh downside would appear if the asset breaks below June 4 low of 0.8900, which will open room for March 21 low at 0.8840 and the round-level support of 0.8800.
On the flip side, a recovery move above the psychological resistance of 0.9000 will drive the asset towards June 3 high at 0.9036, followed by May 28 low at 0.9086.
USD/CHF daily chart
Author

Sagar Dua
FXStreet
Sagar Dua is associated with the financial markets from his college days. Along with pursuing post-graduation in Commerce in 2014, he started his markets training with chart analysis.


