|

USD/CHF Price Analysis: Falls to two-month lows, below 0.8900

  • USD/CHF plunges to a two-month low of 0.8889, down 0.72%, due to weaker-than-expected US labor data and a weakened US Dollar.
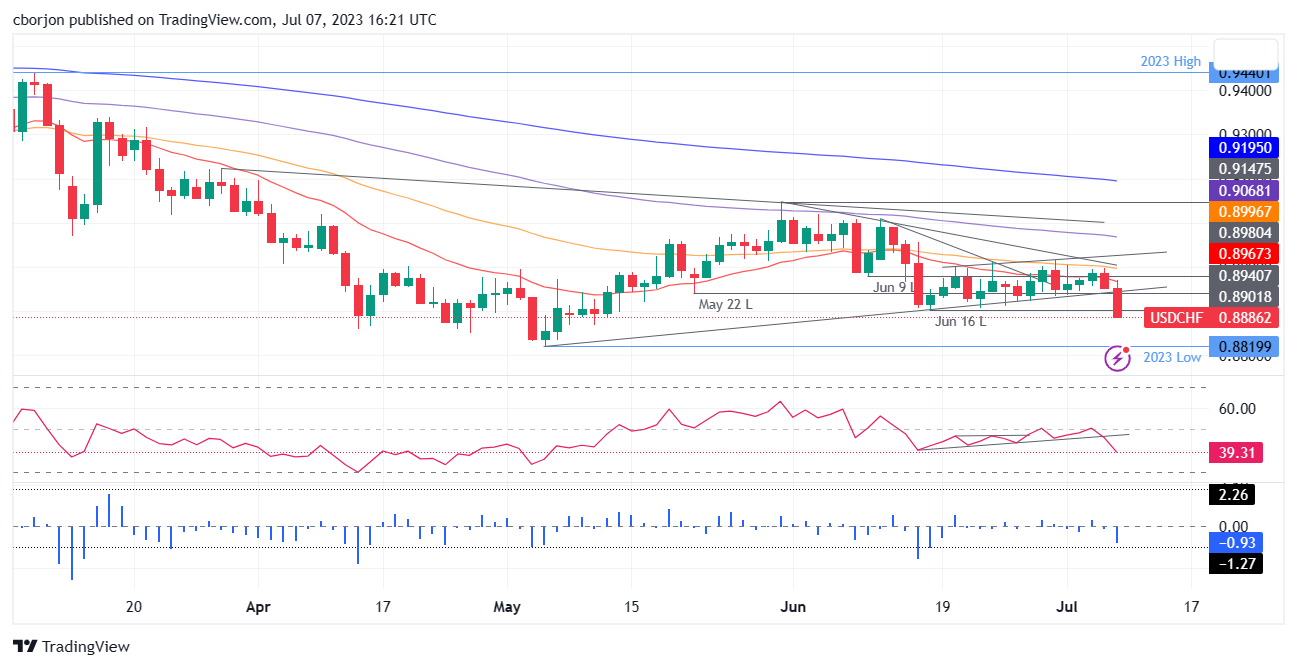
  • The pair breaches a two-month support trendline, extending losses below 0.8900.
  • The next target is the year-to-date low of 0.8819, pending a breakthrough of the 0.8850 psychological level.
  • If buyers reclaim 0.8900, initial resistance lies at 0.8950, followed by the 20-day EMA at 0.8967 and the 50-day EMA at 0.8997.

USD/CHF dives into a new two-month-old on Friday after labor data from the United States (US) was softer than expected, weakening the US Dollar (USD). Earlier, the USD/CHF hit a daily high of 0.8970, which dropped below the 0.8900 figure on the data release. The USD/CHF is trading at 0.8889, down 0.72%.

USD/CHF Price Analysis: Technical outlook

From a daily chart perspective, the USD/CHF extended its losses past the 0.8900 mark after breaking a two-month-old support trendline. That exacerbated the USD/CHF fall below the June 16 swing low of 0.8901, intermediate support opening the door for a test of the year-to-date (YTD) low of 0.8819. Nevertheless, the USD/CHF must surpass the 0.8850 psychological level on its way down.

Notably, the Relative Strength Index (RSI) indicator and the three-day Rate of Change (RoC) suggested that sellers remain in charge, as both turned bearish.

Conversely, if USD/CHF buyers reclaim 0.8900, the first resistance would emerge at 0.8950. A breach of the latter, the USD/CHF could rally to the 20-day EMA at 0.8967, followed by the 50-day EMA at 0.8997. A breach of the latter will put into play the 0.9000 figure.

USD/CHF Price Action – Daily chart

USD/CHF Daily chart

USD/CHF

Overview
Today last price0.8888
Today Daily Change-0.0064
Today Daily Change %-0.71
Today daily open0.8952
 
Trends
Daily SMA200.8976
Daily SMA500.8985
Daily SMA1000.9074
Daily SMA2000.9287
 
Levels
Previous Daily High0.8998
Previous Daily Low0.8951
Previous Weekly High0.9017
Previous Weekly Low0.8912
Previous Monthly High0.912
Previous Monthly Low0.8902
Daily Fibonacci 38.2%0.8969
Daily Fibonacci 61.8%0.898
Daily Pivot Point S10.8936
Daily Pivot Point S20.892
Daily Pivot Point S30.8889
Daily Pivot Point R10.8983
Daily Pivot Point R20.9014
Daily Pivot Point R30.903

Author

Christian Borjon Valencia

Markets analyst, news editor, and trading instructor with over 14 years of experience across FX, commodities, US equity indices, and global macro markets.

More from Christian Borjon Valencia
Share:

Editor's Picks

AUD/USD falls to near 0.7100 after slipping below 50-day EMA

AUD/USD depreciates after registering minor gains in the previous day, trading around 0.7120 during the Asian hours. The technical analysis of the daily chart shows the pair consolidating sideways within a rectangle pattern, as neither bulls nor bears gain control. The AUD/USD pair is holding a slight bearish tone however as it sits beneath both the nine-day and 50-day EMAs.

160.00: USD/JPY back near intervention territory after upbeat US jobs report

US Nonfarm Payrolls beat expectations by a wide margin in May, with 172K jobs added. The US Dollar rebounds after the release, helping USD/JPY recover from its intraday lows. Warnings from Japanese authorities continue to limit upside potential near the 160.00 threshold.

Gold targets $4,300 amid stronger Dollar

Gold faces increasing selling interest and navigates the area of three-month lows near the $4,300 mark per troy ounce on Friday. The precious metal’s decline comes as traders assess the stronger-than-expected NFP, while the bid bias in the Greenback and higher US Treasury yields also collaborate with the retracement.

Cardano hits five-year low even as Hoskinson clarifies "break" isn't an exit

Cardano (ADA) price is down 10% at press time on Friday, extending losses over 30% so far this week amid Charles Hoskinson's clarification that "break" isn't an exit.

Week ahead – Fed countdown begins amid US inflation data and geopolitical risks

Fed Chair Warsh’s first meeting approaches as key US inflation data could reshape expectations. Oil prices remain elevated as US-Iran talks continue; tariffs also return to the spotlight. ECB is expected to hike; will it be a one-off move or is July live?

The US economy defies the rules: 100 days into the Oil shock and the recession signal is still missing

More than three months after the start of the Iran war and the resulting disruption to global energy markets, the US economy continues to display remarkable resilience. The conflict has triggered a sharp rise in Oil prices, reignited inflationary pressures and fueled widespread concerns about a potential economic slowdown.