|

USD/CHF Price Analysis: Extends its upside around the 0.9000 mark amid overbought RSI

  • USD/CHF extends its upside for the third straight day, hovering around the 0.9000 area.
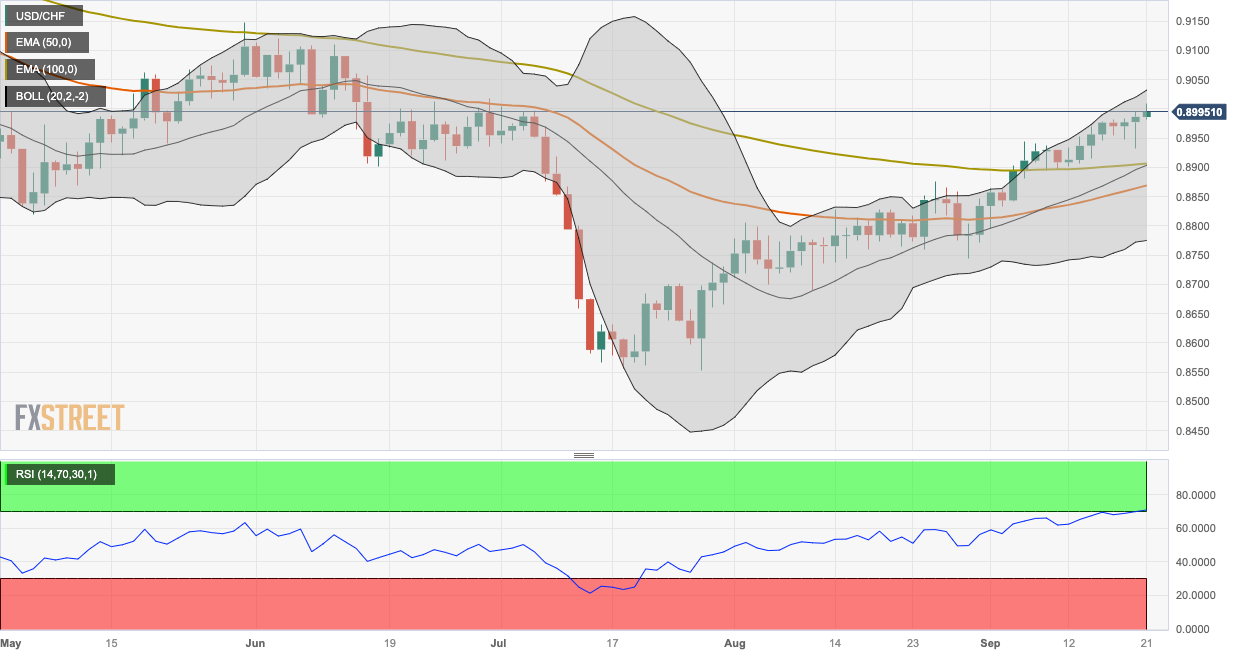
  • The pair holds above the 50- and 100-hour EMAs; Overbought RSI condition indicates that further consolidation cannot be ruled out.
  • The immediate resistance level emerges at 0.9032; 0.8906 acts as a critical support level for the pair.

The USD/CHF pair gains momentum near the 0.9000 psychological mark during the early European session on Thursday. Market players await the Swiss National Bank (SNB) interest rate decision later in the day.

SNB is expected to raise additional interest rates by 25 basis points (bps) from 1.75% to 2% on Thursday. However, if SNB offers hints about its last hike, the monetary policy divergences between the US and Switzerland might continue to drive the pair higher.

On the US Dollar front, the Federal Reserve (Fed) held interest rates unchanged at the 5.25-5.50% range on Wednesday, as widely predicted in the market. Fed Chairman Jerome Powell reaffirmed the Fed's commitment to achieving 2% inflation in a press conference while mentioning that the Fed is ready to raise rates if necessary. These hawkish remarks boost the Greenback against the Swiss Franc and act as a tailwind for the USD/CHF pair.

According to the four-hour chart, USD/CHF holds above the 50- and 100-hour Exponential Moving Averages (EMAs), which means the path of least resistance for the pair is to the upside. The Relative Strength Index (RSI) holds in bullish territory above 50. However, the overbought condition indicates that further consolidation cannot be ruled out before positioning for any near-term USD/CHF appreciation.

That said, the immediate resistance level for USD/CHF will emerge near the upper boundary of the Bollinger Band at 0.9032. The additional upside filter is located at 0.9060 (a high of May 19) en route to 0.9073 (a high of May 25) and finally at 0.9105 (a high of June 8).

On the downside, the 100-hour EMA at 0.8906 acts as a critical support level for the pair. Further south, the next stop of the USD/CHF pair is located at 0.8870 (the 50-hour EMA), followed by a psychological round figure at 0.8800. Any intraday pullback below the latter would expose the next downside stop at 0.8775, portraying the confluence of the lower limit of the Bollinger Band and a low of August 23.

USD/CHF four-hour chart
USD/CHF

Overview
Today last price0.8996
Today Daily Change0.0010
Today Daily Change %0.11
Today daily open0.8986
 
Trends
Daily SMA200.8896
Daily SMA500.8788
Daily SMA1000.8882
Daily SMA2000.9037
 
Levels
Previous Daily High0.8996
Previous Daily Low0.8932
Previous Weekly High0.8978
Previous Weekly Low0.8897
Previous Monthly High0.8876
Previous Monthly Low0.869
Daily Fibonacci 38.2%0.8971
Daily Fibonacci 61.8%0.8956
Daily Pivot Point S10.8947
Daily Pivot Point S20.8908
Daily Pivot Point S30.8884
Daily Pivot Point R10.9011
Daily Pivot Point R20.9035
Daily Pivot Point R30.9074

Author

Lallalit Srijandorn

Lallalit Srijandorn is a Parisian at heart. She has lived in France since 2019 and now becomes a digital entrepreneur based in Paris and Bangkok.


More from Lallalit Srijandorn
Share:

Editor's Picks

AUD/USD stays weak above 0.6900 after China’s trade data

AUD/USD struggles to capitalize on the previous day’s recovery and stays defensive on the 0.6900 level following the narrowing of trade surplus in China. Increased December Fed rate hike bets allows the US Dollar to pause its decline and weigh on the pair. US CPI data is next of note for the major.

USD/JPY retakes 158.00 on weak Japanese data; focus shifts to US CPI

USD/JPY attracts some dip-buyers and retakes 158.00 in the Asian session on Tuesday as a fall in Japan’s Household Spending offsets hawkish BoJ Summary of Opinions, undermining the Japanese Yen. Moreover, Fed hike bets support the safe-haven US Dollar and the currency pair. The market focus now shifts to the release of the crucial US CPI report.

Gold flirts with $4,000 on solid USD buying

Gold slips back to the proximity of the key $4,000 mark per troy ounce on Tuesday, reaching new four-day lows at the same time. The yellow metal’s severe retracement follows the firm performance of the US Dollar, rising US Treasury yields across the curve and reignited speculation of extra Fed tightening.

Pi Network rebounds from record lows, exits oversold territory as momentum improves

Pi Network (PI) shows a strong recovery on Tuesday, up over 7% after recording its all-time low of $0.0624 the previous day. PI token’s appeal in the derivatives market shows minor improvement, with Open Interest rising to $6.21 million.

Five risks for the global economy in 2027

From AI bubbles to geopolitical breakthroughs, these are some of the five ways why this outlook could go wrong – or right: A severe correction in US stocks triggered by an AI meltdown, second-round inflation effects emerge at scale or geopolitical de-escalation delivers an energy peace dividend.


Gold reclaimed $4,100. Tuesday’s CPI test decides if it holds
Gold (XAU/USD) starts the week on a positive note, reclaiming the $4,100 psychological level as the US Dollar (USD) retreats from its recent highs. The precious metal recovers from Friday's losses, although investors remain cautious ahead of Tuesday's US Consumer Price Index (CPI) report, which could determine the next direction for Bullion.