USD/CHF Price Analysis: Drops below 0.9400 as a falling wedge emerged
- Broad US Dollar weakness across the board, a headwind for the USD/CHF.
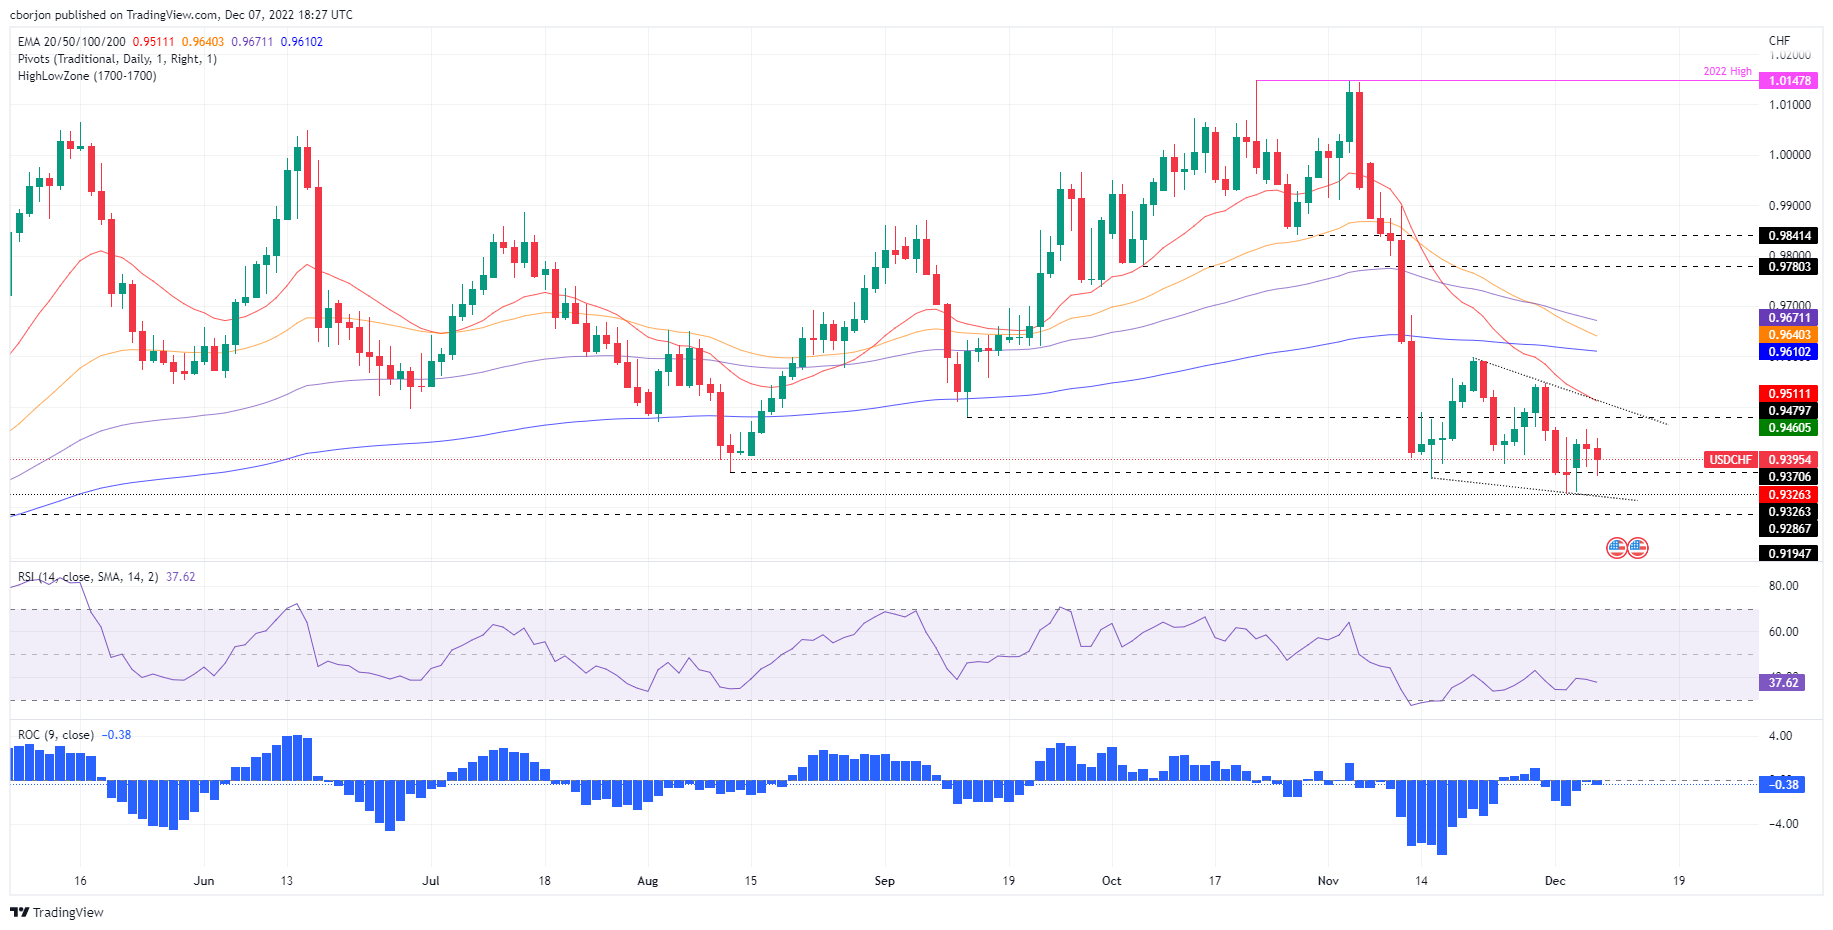
- A falling wedge in the USD/CHF daily chart suggests the pair might break upwards
- USD/CHF: A break below 0.9326 might pave the way to 0.9300; otherwise, a rally to 0.9400 is on the cards.

The USD/CHF extends its losses for two consecutive trading sessions, down by a minuscule 0.22%, after hitting a daily high of 0.9437. At the time of writing, the USD/CHF is trading at 0.9396, as the US Dollar Index (DXY) plunges 0.51%.
USD/CHF Price Analysis: Technical outlook
From a daily chart perspective, the USD/CHF daily chart suggests the pair is downward biased. Since mid-November, the USD/CHF has formed a falling wedge, a bullish continuation chart pattern, which appeared, following the massive swing from around 2022 highs of 1.0147, towards the last week’s 0.9326 low. Therefore, the USD/CHF might consolidate between the wedge boundaries before breaking upwards/downwards.
Oscillators give mixed signals, with the Relative Strength Index (RSI) aiming downwards, while the Rate of Change (RoC) portrays selling pressure fading. Unless the USD/CHF breaks below 0.9326 and poses a challenge to break the wedge on the downside, that could lay the ground for a test of the 0.9300 figure.
As an alternate scenario, the USD/CHF first resistance would be the 0.9400 figure, followed by the September 13 daily low-turned-resistance at 0.9479, followed by the wedge’s top-trendline at 0.9505, and the 20-day Exponential Moving Average (EMA) At 0.9510.
USD/CHF Key Technical Levels
Author

Christian Borjon Valencia
FXStreet
Markets analyst, news editor, and trading instructor with over 14 years of experience across FX, commodities, US equity indices, and global macro markets.


